
 Yahoo Finance
 Yoshitsu (NASDAQ:TKLF) Could Be Struggling To Allocate Capital
What are the early trends we should look for to identify a stock that could multiply in value over the long term? Firstly, we'd want to identify a growing return on capital employed (ROCE) and then alongside that, an ever-increasing base of capital employed. Basically this means that a company has profitable initiatives that it can continue to reinvest in, which is a trait of a compounding machine. In light of that, when we looked at Yoshitsu (NASDAQ:TKLF) and its ROCE trend, we weren't exactly thrilled.
Return On Capital Employed (ROCE): What Is It?
Just to clarify if you're unsure, ROCE is a metric for evaluating how much pre-tax income (in percentage terms) a company earns on the capital invested in its business. Analysts use this formula to calculate it for Yoshitsu:
Return on Capital Employed = Earnings Before Interest and Tax (EBIT) ÷ (Total Assets - Current Liabilities)
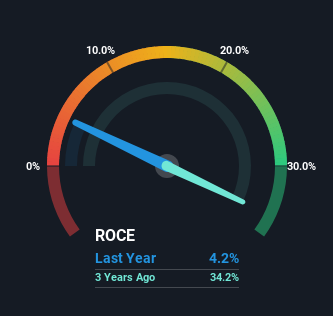
0.042 = JP¥305m ÷ (JP¥21b - JP¥14b) (Based on the trailing twelve months to March 2024).
Therefore, Yoshitsu has an ROCE of 4.2%. In absolute terms, that's a low return and it also under-performs the Specialty Retail industry average of 12%.
See our latest analysis for Yoshitsu
While the past is not representative of the future, it can be helpful to know how a company has performed historically, which is why we have this chart above. If you're interested in investigating Yoshitsu's past further, check out this free graph covering Yoshitsu's past earnings, revenue and cash flow.
How Are Returns Trending?
The trend of ROCE doesn't look fantastic because it's fallen from 39% five years ago, while the business's capital employed increased by 248%. However, some of the increase in capital employed could be attributed to the recent capital raising that's been completed prior to their latest reporting period, so keep that in mind when looking at the ROCE decrease. Yoshitsu probably hasn't received a full year of earnings yet from the new funds it raised, so these figures should be taken with a grain of salt.
On a separate but related note, it's important to know that Yoshitsu has a current liabilities to total assets ratio of 66%, which we'd consider pretty high. This can bring about some risks because the company is basically operating with a rather large reliance on its suppliers or other sorts of short-term creditors. While it's not necessarily a bad thing, it can be beneficial if this ratio is lower.
What We Can Learn From Yoshitsu's ROCE
In summary, despite lower returns in the short term, we're encouraged to see that Yoshitsu is reinvesting for growth and has higher sales as a result. But since the stock has dived 80% in the last year, there could be other drivers that are influencing the business' outlook. Regardless, reinvestment can pay off in the long run, so we think astute investors may want to look further into this stock.
Since virtually every company faces some risks, it's worth knowing what they are, and we've spotted 6 warning signs for Yoshitsu (of which 2 shouldn't be ignored!) that you should know about.
For those who like to invest in solid companies, check out this free list of companies with solid balance sheets and high returns on equity.
Have feedback on this article? Concerned about the content? Get in touch with us directly. Alternatively, email editorial-team (at) simplywallst.com.
This article by Simply Wall St is general in nature. We provide commentary based on historical data and analyst forecasts only using an unbiased methodology and our articles are not intended to be financial advice. It does not constitute a recommendation to buy or sell any stock, and does not take account of your objectives, or your financial situation. We aim to bring you long-term focused analysis driven by fundamental data. Note that our analysis may not factor in the latest price-sensitive company announcements or qualitative material. Simply Wall St has no position in any stocks mentioned.
Have feedback on this article? Concerned about the content? Get in touch with us directly. Alternatively, email editorial-team@simplywallst.com
