
 Yahoo Finance
 YTL Corporation Berhad's (KLSE:YTL) Returns On Capital Are Heading Higher
What trends should we look for it we want to identify stocks that can multiply in value over the long term? In a perfect world, we'd like to see a company investing more capital into its business and ideally the returns earned from that capital are also increasing. Ultimately, this demonstrates that it's a business that is reinvesting profits at increasing rates of return. With that in mind, we've noticed some promising trends at YTL Corporation Berhad (KLSE:YTL) so let's look a bit deeper.
Understanding Return On Capital Employed (ROCE)
For those who don't know, ROCE is a measure of a company's yearly pre-tax profit (its return), relative to the capital employed in the business. Analysts use this formula to calculate it for YTL Corporation Berhad:
Return on Capital Employed = Earnings Before Interest and Tax (EBIT) ÷ (Total Assets - Current Liabilities)
0.10 = RM7.2b ÷ (RM84b - RM13b) (Based on the trailing twelve months to March 2024).
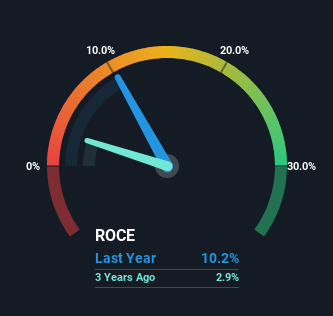
So, YTL Corporation Berhad has an ROCE of 10%. In absolute terms, that's a satisfactory return, but compared to the Integrated Utilities industry average of 5.1% it's much better.
Check out our latest analysis for YTL Corporation Berhad
Above you can see how the current ROCE for YTL Corporation Berhad compares to its prior returns on capital, but there's only so much you can tell from the past. If you'd like to see what analysts are forecasting going forward, you should check out our free analyst report for YTL Corporation Berhad .
So How Is YTL Corporation Berhad's ROCE Trending?
YTL Corporation Berhad is showing promise given that its ROCE is trending up and to the right. More specifically, while the company has kept capital employed relatively flat over the last five years, the ROCE has climbed 180% in that same time. So it's likely that the business is now reaping the full benefits of its past investments, since the capital employed hasn't changed considerably. It's worth looking deeper into this though because while it's great that the business is more efficient, it might also mean that going forward the areas to invest internally for the organic growth are lacking.
The Bottom Line
As discussed above, YTL Corporation Berhad appears to be getting more proficient at generating returns since capital employed has remained flat but earnings (before interest and tax) are up. And a remarkable 265% total return over the last five years tells us that investors are expecting more good things to come in the future. In light of that, we think it's worth looking further into this stock because if YTL Corporation Berhad can keep these trends up, it could have a bright future ahead.
One more thing to note, we've identified 1 warning sign with YTL Corporation Berhad and understanding it should be part of your investment process.
If you want to search for solid companies with great earnings, check out this free list of companies with good balance sheets and impressive returns on equity.
Have feedback on this article? Concerned about the content? Get in touch with us directly. Alternatively, email editorial-team (at) simplywallst.com.
This article by Simply Wall St is general in nature. We provide commentary based on historical data and analyst forecasts only using an unbiased methodology and our articles are not intended to be financial advice. It does not constitute a recommendation to buy or sell any stock, and does not take account of your objectives, or your financial situation. We aim to bring you long-term focused analysis driven by fundamental data. Note that our analysis may not factor in the latest price-sensitive company announcements or qualitative material. Simply Wall St has no position in any stocks mentioned.
Have feedback on this article? Concerned about the content? Get in touch with us directly. Alternatively, email editorial-team@simplywallst.com
