
 Yahoo Finance
 Zhongxin Fruit and Juice (Catalist:5EG) Could Be Struggling To Allocate Capital
To find a multi-bagger stock, what are the underlying trends we should look for in a business? Ideally, a business will show two trends; firstly a growing return on capital employed (ROCE) and secondly, an increasing amount of capital employed. This shows us that it's a compounding machine, able to continually reinvest its earnings back into the business and generate higher returns. However, after briefly looking over the numbers, we don't think Zhongxin Fruit and Juice (Catalist:5EG) has the makings of a multi-bagger going forward, but let's have a look at why that may be.
Understanding Return On Capital Employed (ROCE)
For those who don't know, ROCE is a measure of a company's yearly pre-tax profit (its return), relative to the capital employed in the business. The formula for this calculation on Zhongxin Fruit and Juice is:
Return on Capital Employed = Earnings Before Interest and Tax (EBIT) ÷ (Total Assets - Current Liabilities)
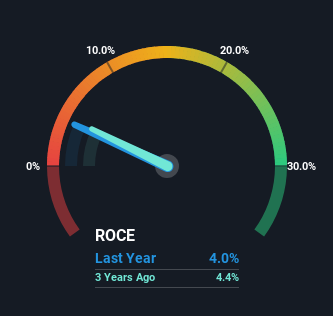
0.04 = CN¥5.5m ÷ (CN¥243m - CN¥105m) (Based on the trailing twelve months to December 2023).
So, Zhongxin Fruit and Juice has an ROCE of 4.0%. Ultimately, that's a low return and it under-performs the Food industry average of 7.4%.
See our latest analysis for Zhongxin Fruit and Juice
While the past is not representative of the future, it can be helpful to know how a company has performed historically, which is why we have this chart above. If you're interested in investigating Zhongxin Fruit and Juice's past further, check out this free graph covering Zhongxin Fruit and Juice's past earnings, revenue and cash flow.
What The Trend Of ROCE Can Tell Us
In terms of Zhongxin Fruit and Juice's historical ROCE movements, the trend isn't fantastic. To be more specific, ROCE has fallen from 18% over the last five years. However it looks like Zhongxin Fruit and Juice might be reinvesting for long term growth because while capital employed has increased, the company's sales haven't changed much in the last 12 months. It may take some time before the company starts to see any change in earnings from these investments.
Another thing to note, Zhongxin Fruit and Juice has a high ratio of current liabilities to total assets of 43%. This effectively means that suppliers (or short-term creditors) are funding a large portion of the business, so just be aware that this can introduce some elements of risk. While it's not necessarily a bad thing, it can be beneficial if this ratio is lower.
The Bottom Line On Zhongxin Fruit and Juice's ROCE
To conclude, we've found that Zhongxin Fruit and Juice is reinvesting in the business, but returns have been falling. Investors must think there's better things to come because the stock has knocked it out of the park, delivering a 375% gain to shareholders who have held over the last five years. But if the trajectory of these underlying trends continue, we think the likelihood of it being a multi-bagger from here isn't high.
On a final note, we found 5 warning signs for Zhongxin Fruit and Juice (2 are a bit concerning) you should be aware of.
While Zhongxin Fruit and Juice may not currently earn the highest returns, we've compiled a list of companies that currently earn more than 25% return on equity. Check out this free list here.
Have feedback on this article? Concerned about the content? Get in touch with us directly. Alternatively, email editorial-team (at) simplywallst.com.
This article by Simply Wall St is general in nature. We provide commentary based on historical data and analyst forecasts only using an unbiased methodology and our articles are not intended to be financial advice. It does not constitute a recommendation to buy or sell any stock, and does not take account of your objectives, or your financial situation. We aim to bring you long-term focused analysis driven by fundamental data. Note that our analysis may not factor in the latest price-sensitive company announcements or qualitative material. Simply Wall St has no position in any stocks mentioned.
