
 Yahoo Finance
 Capital Allocation Trends At OPG Power Ventures (LON:OPG) Aren't Ideal
To avoid investing in a business that's in decline, there's a few financial metrics that can provide early indications of aging. Businesses in decline often have two underlying trends, firstly, a declining return on capital employed (ROCE) and a declining base of capital employed. Basically the company is earning less on its investments and it is also reducing its total assets. In light of that, from a first glance at OPG Power Ventures (LON:OPG), we've spotted some signs that it could be struggling, so let's investigate.
What Is Return On Capital Employed (ROCE)?
If you haven't worked with ROCE before, it measures the 'return' (pre-tax profit) a company generates from capital employed in its business. Analysts use this formula to calculate it for OPG Power Ventures:
Return on Capital Employed = Earnings Before Interest and Tax (EBIT) ÷ (Total Assets - Current Liabilities)
0.044 = UK£9.3m ÷ (UK£262m - UK£50m) (Based on the trailing twelve months to September 2023).
Therefore, OPG Power Ventures has an ROCE of 4.4%. Ultimately, that's a low return and it under-performs the Electric Utilities industry average of 6.9%.
Check out our latest analysis for OPG Power Ventures
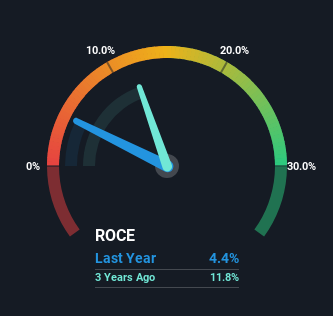
Historical performance is a great place to start when researching a stock so above you can see the gauge for OPG Power Ventures' ROCE against it's prior returns. If you want to delve into the historical earnings , check out these free graphs detailing revenue and cash flow performance of OPG Power Ventures.
What The Trend Of ROCE Can Tell Us
There is reason to be cautious about OPG Power Ventures, given the returns are trending downwards. To be more specific, the ROCE was 10% five years ago, but since then it has dropped noticeably. On top of that, it's worth noting that the amount of capital employed within the business has remained relatively steady. Since returns are falling and the business has the same amount of assets employed, this can suggest it's a mature business that hasn't had much growth in the last five years. If these trends continue, we wouldn't expect OPG Power Ventures to turn into a multi-bagger.
The Bottom Line
In summary, it's unfortunate that OPG Power Ventures is generating lower returns from the same amount of capital. Long term shareholders who've owned the stock over the last five years have experienced a 37% depreciation in their investment, so it appears the market might not like these trends either. Unless there is a shift to a more positive trajectory in these metrics, we would look elsewhere.
Since virtually every company faces some risks, it's worth knowing what they are, and we've spotted 3 warning signs for OPG Power Ventures (of which 1 is a bit unpleasant!) that you should know about.
For those who like to invest in solid companies, check out this free list of companies with solid balance sheets and high returns on equity.
Have feedback on this article? Concerned about the content? Get in touch with us directly. Alternatively, email editorial-team (at) simplywallst.com.
This article by Simply Wall St is general in nature. We provide commentary based on historical data and analyst forecasts only using an unbiased methodology and our articles are not intended to be financial advice. It does not constitute a recommendation to buy or sell any stock, and does not take account of your objectives, or your financial situation. We aim to bring you long-term focused analysis driven by fundamental data. Note that our analysis may not factor in the latest price-sensitive company announcements or qualitative material. Simply Wall St has no position in any stocks mentioned.
Have feedback on this article? Concerned about the content? Get in touch with us directly. Alternatively, email editorial-team@simplywallst.com
