
 Yahoo Finance
 Capital Allocation Trends At TClarke (LON:CTO) Aren't Ideal
If you're not sure where to start when looking for the next multi-bagger, there are a few key trends you should keep an eye out for. In a perfect world, we'd like to see a company investing more capital into its business and ideally the returns earned from that capital are also increasing. Ultimately, this demonstrates that it's a business that is reinvesting profits at increasing rates of return. In light of that, when we looked at TClarke (LON:CTO) and its ROCE trend, we weren't exactly thrilled.
What Is Return On Capital Employed (ROCE)?
For those that aren't sure what ROCE is, it measures the amount of pre-tax profits a company can generate from the capital employed in its business. Analysts use this formula to calculate it for TClarke:
Return on Capital Employed = Earnings Before Interest and Tax (EBIT) ÷ (Total Assets - Current Liabilities)
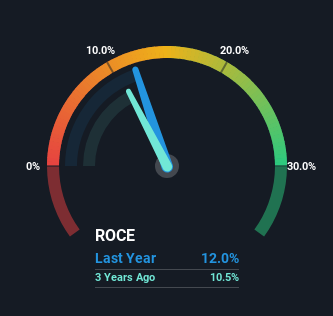
0.12 = UK£8.8m ÷ (UK£219m - UK£146m) (Based on the trailing twelve months to December 2023).
So, TClarke has an ROCE of 12%. That's a relatively normal return on capital, and it's around the 13% generated by the Construction industry.
Check out our latest analysis for TClarke
In the above chart we have measured TClarke's prior ROCE against its prior performance, but the future is arguably more important. If you'd like to see what analysts are forecasting going forward, you should check out our free analyst report for TClarke .
What Does the ROCE Trend For TClarke Tell Us?
In terms of TClarke's historical ROCE movements, the trend isn't fantastic. To be more specific, ROCE has fallen from 18% over the last five years. However, given capital employed and revenue have both increased it appears that the business is currently pursuing growth, at the consequence of short term returns. If these investments prove successful, this can bode very well for long term stock performance.
Another thing to note, TClarke has a high ratio of current liabilities to total assets of 66%. This effectively means that suppliers (or short-term creditors) are funding a large portion of the business, so just be aware that this can introduce some elements of risk. While it's not necessarily a bad thing, it can be beneficial if this ratio is lower.
What We Can Learn From TClarke's ROCE
In summary, despite lower returns in the short term, we're encouraged to see that TClarke is reinvesting for growth and has higher sales as a result. And the stock has followed suit returning a meaningful 59% to shareholders over the last five years. So should these growth trends continue, we'd be optimistic on the stock going forward.
On a separate note, we've found 3 warning signs for TClarke you'll probably want to know about.
For those who like to invest in solid companies, check out this free list of companies with solid balance sheets and high returns on equity.
Have feedback on this article? Concerned about the content? Get in touch with us directly. Alternatively, email editorial-team (at) simplywallst.com.
This article by Simply Wall St is general in nature. We provide commentary based on historical data and analyst forecasts only using an unbiased methodology and our articles are not intended to be financial advice. It does not constitute a recommendation to buy or sell any stock, and does not take account of your objectives, or your financial situation. We aim to bring you long-term focused analysis driven by fundamental data. Note that our analysis may not factor in the latest price-sensitive company announcements or qualitative material. Simply Wall St has no position in any stocks mentioned.
Have feedback on this article? Concerned about the content? Get in touch with us directly. Alternatively, email editorial-team@simplywallst.com
