
 Yahoo Finance
 Comerica's (NYSE:CMA) earnings have declined over five years, contributing to shareholders 9.6% loss
The main aim of stock picking is to find the market-beating stocks. But even the best stock picker will only win with some selections. So we wouldn't blame long term Comerica Incorporated (NYSE:CMA) shareholders for doubting their decision to hold, with the stock down 30% over a half decade. On the other hand the share price has bounced 5.3% over the last week.
On a more encouraging note the company has added US$338m to its market cap in just the last 7 days, so let's see if we can determine what's driven the five-year loss for shareholders.
See our latest analysis for Comerica
There is no denying that markets are sometimes efficient, but prices do not always reflect underlying business performance. One imperfect but simple way to consider how the market perception of a company has shifted is to compare the change in the earnings per share (EPS) with the share price movement.
Looking back five years, both Comerica's share price and EPS declined; the latter at a rate of 8.4% per year. The share price decline of 7% per year isn't as bad as the EPS decline. The relatively muted share price reaction might be because the market expects the business to turn around.
The company's earnings per share (over time) is depicted in the image below (click to see the exact numbers).
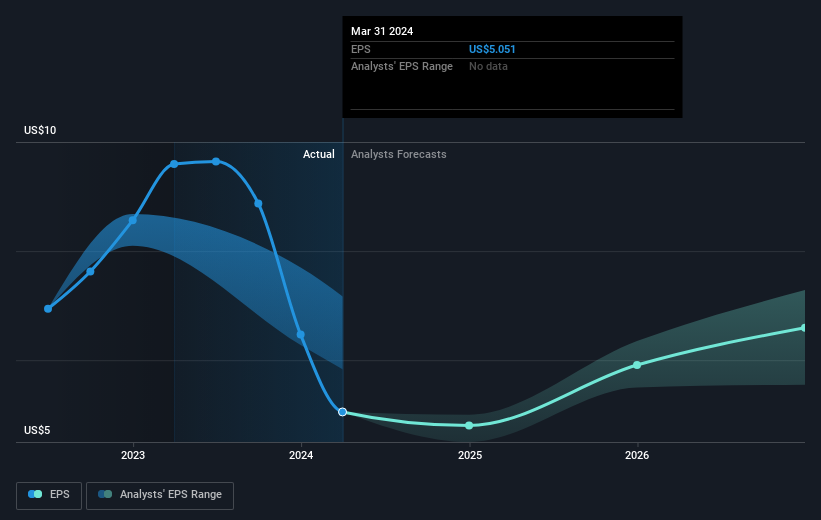
This free interactive report on Comerica's earnings, revenue and cash flow is a great place to start, if you want to investigate the stock further.
What About Dividends?
As well as measuring the share price return, investors should also consider the total shareholder return (TSR). Whereas the share price return only reflects the change in the share price, the TSR includes the value of dividends (assuming they were reinvested) and the benefit of any discounted capital raising or spin-off. Arguably, the TSR gives a more comprehensive picture of the return generated by a stock. We note that for Comerica the TSR over the last 5 years was -9.6%, which is better than the share price return mentioned above. The dividends paid by the company have thusly boosted the total shareholder return.
A Different Perspective
Comerica's TSR for the year was broadly in line with the market average, at 23%. To take a positive view, the gain is pleasing, and it sure beats annualized TSR loss of 1.8%, which was endured over half a decade. While 'turnarounds seldom turn' there are green shoots for Comerica. While it is well worth considering the different impacts that market conditions can have on the share price, there are other factors that are even more important. For instance, we've identified 1 warning sign for Comerica that you should be aware of.
Of course, you might find a fantastic investment by looking elsewhere. So take a peek at this free list of companies we expect will grow earnings.
Please note, the market returns quoted in this article reflect the market weighted average returns of stocks that currently trade on American exchanges.
Have feedback on this article? Concerned about the content? Get in touch with us directly. Alternatively, email editorial-team (at) simplywallst.com.
This article by Simply Wall St is general in nature. We provide commentary based on historical data and analyst forecasts only using an unbiased methodology and our articles are not intended to be financial advice. It does not constitute a recommendation to buy or sell any stock, and does not take account of your objectives, or your financial situation. We aim to bring you long-term focused analysis driven by fundamental data. Note that our analysis may not factor in the latest price-sensitive company announcements or qualitative material. Simply Wall St has no position in any stocks mentioned.
Have feedback on this article? Concerned about the content? Get in touch with us directly. Alternatively, email editorial-team@simplywallst.com
