
 Yahoo Finance
 Copa Holdings (CPA) Stock Down 5.4% Despite Q2 Earnings Beat
Copa Holdings, S.A. (CPA) stock declined 5.4% since its second-quarter 2023 earnings release on Aug 9. Quarterly earnings per share (EPS) of $3.92 surpassed the Zacks Consensus Estimate of $3.25 and rose more than 100% year over year. Revenues of $809.2 million beat the Zacks Consensus Estimate of $797 million and improved 16.7% year over year on the back of passenger revenues.
Copa Holdings, S.A. Price, Consensus and EPS Surprise
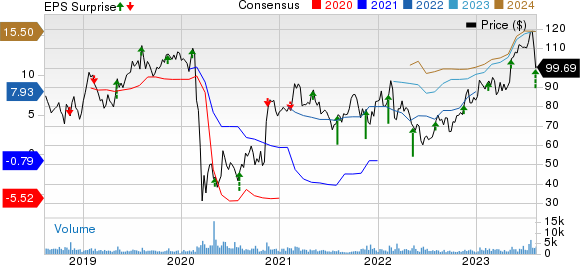
Copa Holdings, S.A. price-consensus-eps-surprise-chart | Copa Holdings, S.A. Quote
Passenger revenues (contributed 95.6% to the top line) increased 17.8% from second-quarter 2022, owing to higher load factors and yields. Cargo and mail revenues fell 10.6% to $23.9 million due to lower cargo volumes and yields. Other operating revenues came in at $11.5 million, up 18.6% year over year on the back of revenues from non-air ConnectMiles partners.
Below, we present all comparisons (in % terms) with second-quarter 2022 levels (pre-coronavirus).
On a consolidated basis, traffic (measured in revenue passenger miles) grew 15.4% and capacity (measured in available seat miles) increased 13.6%. As a result, the load factor increased 1.3 percentage points to 86.1% in the reported quarter.
Passenger revenue per available seat miles increased 3.6% to 11.4 cents. Additionally, revenue per available seat mile increased 2.7% to 12 cents. Cost per available seat mile decreased 17%. Excluding fuel, the metric fell 0.8%. The average fuel price per liter fell 35.9% to $2.65.
Total operating expenses decreased 5.6% to $614.52 million due to the 27.7% decrease in fuel costs. Expenses on wages, salaries and other employee benefits rose 18.9% owing to growth in operational staff to support current capacity, as well as salary adjustments and provisions for variable compensation. Sales and distribution costs increased 0.7% due to an increase in ticket sales. Passenger servicing costs grew 33.5%. Flight operation costs increased 3.9%.
Copa Holdings exited the second quarter with cash and cash equivalents of $281.86 million compared with $242.31 million at March 2023-end. Total debt, including lease liabilities, was $1.8 billion compared with $1.7 billion at the end of March 2023.
CPA ended second-quarter 2023 with aconsolidated fleetof 101 aircraft, which comprises 67 Boeing 737-800s, 24 Boeing 737 MAX 9s, 9 Boeing 737-700s, and 1 Boeing 737-800 freighter. During the reported quarter, the carrier took delivery of two Boeing 737 MAX 9 aircraft.
Outlook for 2023
For 2023, Copa Holdings expects its consolidated capacity or ASMs to register 12-13% growth over 2022, and its operating margin is expected to be between 22% and 24%.
Load factor is now expected to be around 86% (prior view: 85%).
Currently, Copa Holdings carries a Zacks Rank #3 (Hold). You can see the complete list of today’s Zacks #1 Rank (Strong Buy) stocks here.
Performances of Other Transportation Companies
J.B. Hunt Transport Services, Inc.’s JBHT second-quarter 2023 EPS of $1.81 missed the Zacks Consensus Estimate of $1.97 and declined 25.2% year over year.
JBHT’s total operating revenues of $3,132.6 million also lagged the Zacks Consensus Estimate of $3,347.5 million and fell 18.4% year over year. The downfall was due to a decline in revenue per load of 24% in Integrated Capacity Solutions, 13% in Intermodal, 21% in Truckload and a 4% decline in productivity in Dedicated Capacity Solutions on the back of changes in customer rate, freight mix and lower fuel surcharge revenue.
Total operating revenues, excluding fuel surcharges, decreased 14% year over year.
Delta Air Lines DAL reported better-than-expected revenues and EPS, driven by strong air-travel demand. DAL’s second-quarter 2023 EPS (excluding 16 cents from non-recurring items) of $2.68 comfortably beat the Zacks Consensus Estimate of $2.42. DAL reported EPS of $1.44 a year ago, dull compared to the current scenario, as air-travel demand was not so buoyant then.
DAL’s total revenues of $15,578 million beat the Zacks Consensus Estimate of $14,991.6 million. Total revenues increased 12.69% on a year-over-year basis, driven by higher air-travel demand.
United Airlines Holdings, Inc. (UAL) reported second-quarter 2023 EPS of $5.03, which outpaced the Zacks Consensus Estimate of $3.99 and improved more than 100% year over year.
Operating revenues of $14,178 million beat the Zacks Consensus Estimate of $13,927.1 million. UAL’s revenues increased 17.1% year over year due to upbeat air-travel demand. The year-over-year increase in the top line was driven by a 20.1% rise in passenger revenues (accounting for 91.7% of the top line) to $13,002 million. Nearly 42 million passengers traveled on UAL flights in the second quarter.
Want the latest recommendations from Zacks Investment Research? Today, you can download 7 Best Stocks for the Next 30 Days. Click to get this free report
Delta Air Lines, Inc. (DAL) : Free Stock Analysis Report
United Airlines Holdings Inc (UAL) : Free Stock Analysis Report
J.B. Hunt Transport Services, Inc. (JBHT) : Free Stock Analysis Report
Copa Holdings, S.A. (CPA) : Free Stock Analysis Report
