
 Yahoo Finance
 Dürr (ETR:DUE) Is Reinvesting At Lower Rates Of Return
Finding a business that has the potential to grow substantially is not easy, but it is possible if we look at a few key financial metrics. Typically, we'll want to notice a trend of growing return on capital employed (ROCE) and alongside that, an expanding base of capital employed. Put simply, these types of businesses are compounding machines, meaning they are continually reinvesting their earnings at ever-higher rates of return. However, after briefly looking over the numbers, we don't think Dürr (ETR:DUE) has the makings of a multi-bagger going forward, but let's have a look at why that may be.
Return On Capital Employed (ROCE): What Is It?
For those that aren't sure what ROCE is, it measures the amount of pre-tax profits a company can generate from the capital employed in its business. Analysts use this formula to calculate it for Dürr:
Return on Capital Employed = Earnings Before Interest and Tax (EBIT) ÷ (Total Assets - Current Liabilities)
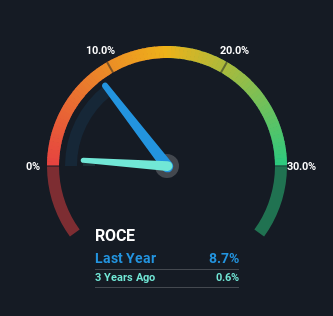
0.087 = €208m ÷ (€5.2b - €2.8b) (Based on the trailing twelve months to March 2024).
So, Dürr has an ROCE of 8.7%. In absolute terms, that's a low return but it's around the Machinery industry average of 11%.
Check out our latest analysis for Dürr
Above you can see how the current ROCE for Dürr compares to its prior returns on capital, but there's only so much you can tell from the past. If you'd like to see what analysts are forecasting going forward, you should check out our free analyst report for Dürr .
What Does the ROCE Trend For Dürr Tell Us?
When we looked at the ROCE trend at Dürr, we didn't gain much confidence. Around five years ago the returns on capital were 13%, but since then they've fallen to 8.7%. However it looks like Dürr might be reinvesting for long term growth because while capital employed has increased, the company's sales haven't changed much in the last 12 months. It may take some time before the company starts to see any change in earnings from these investments.
On a side note, Dürr's current liabilities are still rather high at 54% of total assets. This can bring about some risks because the company is basically operating with a rather large reliance on its suppliers or other sorts of short-term creditors. Ideally we'd like to see this reduce as that would mean fewer obligations bearing risks.
In Conclusion...
Bringing it all together, while we're somewhat encouraged by Dürr's reinvestment in its own business, we're aware that returns are shrinking. And in the last five years, the stock has given away 18% so the market doesn't look too hopeful on these trends strengthening any time soon. In any case, the stock doesn't have these traits of a multi-bagger discussed above, so if that's what you're looking for, we think you'd have more luck elsewhere.
On a separate note, we've found 1 warning sign for Dürr you'll probably want to know about.
While Dürr isn't earning the highest return, check out this free list of companies that are earning high returns on equity with solid balance sheets.
Have feedback on this article? Concerned about the content? Get in touch with us directly. Alternatively, email editorial-team (at) simplywallst.com.
This article by Simply Wall St is general in nature. We provide commentary based on historical data and analyst forecasts only using an unbiased methodology and our articles are not intended to be financial advice. It does not constitute a recommendation to buy or sell any stock, and does not take account of your objectives, or your financial situation. We aim to bring you long-term focused analysis driven by fundamental data. Note that our analysis may not factor in the latest price-sensitive company announcements or qualitative material. Simply Wall St has no position in any stocks mentioned.
