
 Yahoo Finance
 Exco Technologies (TSE:XTC) Could Be Struggling To Allocate Capital
If you're not sure where to start when looking for the next multi-bagger, there are a few key trends you should keep an eye out for. In a perfect world, we'd like to see a company investing more capital into its business and ideally the returns earned from that capital are also increasing. Basically this means that a company has profitable initiatives that it can continue to reinvest in, which is a trait of a compounding machine. Having said that, from a first glance at Exco Technologies (TSE:XTC) we aren't jumping out of our chairs at how returns are trending, but let's have a deeper look.
What Is Return On Capital Employed (ROCE)?
For those who don't know, ROCE is a measure of a company's yearly pre-tax profit (its return), relative to the capital employed in the business. Analysts use this formula to calculate it for Exco Technologies:
Return on Capital Employed = Earnings Before Interest and Tax (EBIT) ÷ (Total Assets - Current Liabilities)
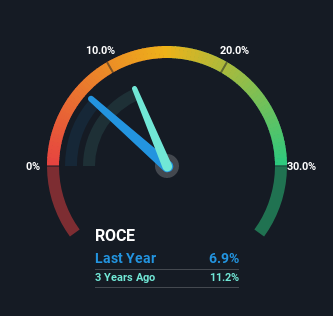
0.069 = CA$34m ÷ (CA$585m - CA$97m) (Based on the trailing twelve months to December 2022).
Thus, Exco Technologies has an ROCE of 6.9%. Ultimately, that's a low return and it under-performs the Auto Components industry average of 8.8%.
View our latest analysis for Exco Technologies
Above you can see how the current ROCE for Exco Technologies compares to its prior returns on capital, but there's only so much you can tell from the past. If you'd like to see what analysts are forecasting going forward, you should check out our free report for Exco Technologies.
What Can We Tell From Exco Technologies' ROCE Trend?
On the surface, the trend of ROCE at Exco Technologies doesn't inspire confidence. Around five years ago the returns on capital were 17%, but since then they've fallen to 6.9%. Although, given both revenue and the amount of assets employed in the business have increased, it could suggest the company is investing in growth, and the extra capital has led to a short-term reduction in ROCE. And if the increased capital generates additional returns, the business, and thus shareholders, will benefit in the long run.
The Bottom Line On Exco Technologies' ROCE
In summary, despite lower returns in the short term, we're encouraged to see that Exco Technologies is reinvesting for growth and has higher sales as a result. In light of this, the stock has only gained 2.1% over the last five years. Therefore we'd recommend looking further into this stock to confirm if it has the makings of a good investment.
One more thing to note, we've identified 2 warning signs with Exco Technologies and understanding these should be part of your investment process.
While Exco Technologies isn't earning the highest return, check out this free list of companies that are earning high returns on equity with solid balance sheets.
Have feedback on this article? Concerned about the content? Get in touch with us directly. Alternatively, email editorial-team (at) simplywallst.com.
This article by Simply Wall St is general in nature. We provide commentary based on historical data and analyst forecasts only using an unbiased methodology and our articles are not intended to be financial advice. It does not constitute a recommendation to buy or sell any stock, and does not take account of your objectives, or your financial situation. We aim to bring you long-term focused analysis driven by fundamental data. Note that our analysis may not factor in the latest price-sensitive company announcements or qualitative material. Simply Wall St has no position in any stocks mentioned.
Join A Paid User Research Session
You’ll receive a US$30 Amazon Gift card for 1 hour of your time while helping us build better investing tools for the individual investors like yourself. Sign up here
