
 Yahoo Finance
 Fidelity National Financial, Inc.'s (NYSE:FNF) Fundamentals Look Pretty Strong: Could The Market Be Wrong About The Stock?
It is hard to get excited after looking at Fidelity National Financial's (NYSE:FNF) recent performance, when its stock has declined 2.7% over the past three months. But if you pay close attention, you might find that its key financial indicators look quite decent, which could mean that the stock could potentially rise in the long-term given how markets usually reward more resilient long-term fundamentals. In this article, we decided to focus on Fidelity National Financial's ROE.
Return on Equity or ROE is a test of how effectively a company is growing its value and managing investors’ money. In other words, it is a profitability ratio which measures the rate of return on the capital provided by the company's shareholders.
See our latest analysis for Fidelity National Financial
How To Calculate Return On Equity?
The formula for return on equity is:
Return on Equity = Net Profit (from continuing operations) ÷ Shareholders' Equity
So, based on the above formula, the ROE for Fidelity National Financial is:
11% = US$875m ÷ US$7.8b (Based on the trailing twelve months to March 2024).
The 'return' is the yearly profit. That means that for every $1 worth of shareholders' equity, the company generated $0.11 in profit.
Why Is ROE Important For Earnings Growth?
We have already established that ROE serves as an efficient profit-generating gauge for a company's future earnings. Based on how much of its profits the company chooses to reinvest or "retain", we are then able to evaluate a company's future ability to generate profits. Generally speaking, other things being equal, firms with a high return on equity and profit retention, have a higher growth rate than firms that don’t share these attributes.
A Side By Side comparison of Fidelity National Financial's Earnings Growth And 11% ROE
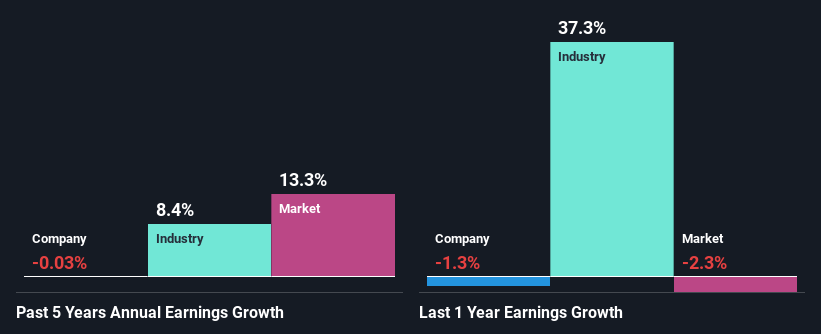
At first glance, Fidelity National Financial seems to have a decent ROE. Further, the company's ROE is similar to the industry average of 13%. Given the circumstances, we can't help but wonder why Fidelity National Financial saw little to no growth in the past five years. Based on this, we feel that there might be other reasons which haven't been discussed so far in this article that could be hampering the company's growth. For example, it could be that the company has a high payout ratio or the business has allocated capital poorly, for instance.
We then compared Fidelity National Financial's net income growth with the industry and found that the average industry growth rate was 8.4% in the same 5-year period.
Earnings growth is a huge factor in stock valuation. It’s important for an investor to know whether the market has priced in the company's expected earnings growth (or decline). Doing so will help them establish if the stock's future looks promising or ominous. Is Fidelity National Financial fairly valued compared to other companies? These 3 valuation measures might help you decide.
Is Fidelity National Financial Using Its Retained Earnings Effectively?
In spite of a normal three-year median payout ratio of 27% (or a retention ratio of 73%), Fidelity National Financial hasn't seen much growth in its earnings. So there might be other factors at play here which could potentially be hampering growth. For example, the business has faced some headwinds.
Moreover, Fidelity National Financial has been paying dividends for at least ten years or more suggesting that management must have perceived that the shareholders prefer dividends over earnings growth.
Conclusion
On the whole, we do feel that Fidelity National Financial has some positive attributes. Although, we are disappointed to see a lack of growth in earnings even in spite of a high ROE and and a high reinvestment rate. We believe that there might be some outside factors that could be having a negative impact on the business. Having said that, looking at current analyst estimates, we found that the company's earnings growth rate is expected to see a huge improvement. To know more about the company's future earnings growth forecasts take a look at this free report on analyst forecasts for the company to find out more.
Have feedback on this article? Concerned about the content? Get in touch with us directly. Alternatively, email editorial-team (at) simplywallst.com.
This article by Simply Wall St is general in nature. We provide commentary based on historical data and analyst forecasts only using an unbiased methodology and our articles are not intended to be financial advice. It does not constitute a recommendation to buy or sell any stock, and does not take account of your objectives, or your financial situation. We aim to bring you long-term focused analysis driven by fundamental data. Note that our analysis may not factor in the latest price-sensitive company announcements or qualitative material. Simply Wall St has no position in any stocks mentioned.
Have feedback on this article? Concerned about the content? Get in touch with us directly. Alternatively, email editorial-team@simplywallst.com
