
 Yahoo Finance
 Indofood Agri Resources (SGX:5JS) Might Have The Makings Of A Multi-Bagger
Finding a business that has the potential to grow substantially is not easy, but it is possible if we look at a few key financial metrics. Ideally, a business will show two trends; firstly a growing return on capital employed (ROCE) and secondly, an increasing amount of capital employed. If you see this, it typically means it's a company with a great business model and plenty of profitable reinvestment opportunities. Speaking of which, we noticed some great changes in Indofood Agri Resources' (SGX:5JS) returns on capital, so let's have a look.
Return On Capital Employed (ROCE): What Is It?
For those that aren't sure what ROCE is, it measures the amount of pre-tax profits a company can generate from the capital employed in its business. The formula for this calculation on Indofood Agri Resources is:
Return on Capital Employed = Earnings Before Interest and Tax (EBIT) ÷ (Total Assets - Current Liabilities)
0.076 = Rp2.1t ÷ (Rp37t - Rp9.6t) (Based on the trailing twelve months to December 2023).
Therefore, Indofood Agri Resources has an ROCE of 7.6%. In absolute terms, that's a low return but it's around the Food industry average of 7.4%.
View our latest analysis for Indofood Agri Resources
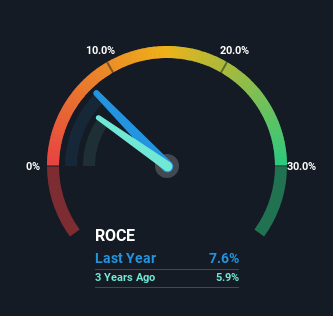
Historical performance is a great place to start when researching a stock so above you can see the gauge for Indofood Agri Resources' ROCE against it's prior returns. If you're interested in investigating Indofood Agri Resources' past further, check out this free graph covering Indofood Agri Resources' past earnings, revenue and cash flow.
What Can We Tell From Indofood Agri Resources' ROCE Trend?
Indofood Agri Resources' ROCE growth is quite impressive. Looking at the data, we can see that even though capital employed in the business has remained relatively flat, the ROCE generated has risen by 197% over the last five years. Basically the business is generating higher returns from the same amount of capital and that is proof that there are improvements in the company's efficiencies. The company is doing well in that sense, and it's worth investigating what the management team has planned for long term growth prospects.
Our Take On Indofood Agri Resources' ROCE
To bring it all together, Indofood Agri Resources has done well to increase the returns it's generating from its capital employed. Investors may not be impressed by the favorable underlying trends yet because over the last five years the stock has only returned 14% to shareholders. So exploring more about this stock could uncover a good opportunity, if the valuation and other metrics stack up.
While Indofood Agri Resources looks impressive, no company is worth an infinite price. The intrinsic value infographic for 5JS helps visualize whether it is currently trading for a fair price.
While Indofood Agri Resources may not currently earn the highest returns, we've compiled a list of companies that currently earn more than 25% return on equity. Check out this free list here.
Have feedback on this article? Concerned about the content? Get in touch with us directly. Alternatively, email editorial-team (at) simplywallst.com.
This article by Simply Wall St is general in nature. We provide commentary based on historical data and analyst forecasts only using an unbiased methodology and our articles are not intended to be financial advice. It does not constitute a recommendation to buy or sell any stock, and does not take account of your objectives, or your financial situation. We aim to bring you long-term focused analysis driven by fundamental data. Note that our analysis may not factor in the latest price-sensitive company announcements or qualitative material. Simply Wall St has no position in any stocks mentioned.
Have feedback on this article? Concerned about the content? Get in touch with us directly. Alternatively, email editorial-team@simplywallst.com
