
 Yahoo Finance
 LPA Group (LON:LPA) Might Be Having Difficulty Using Its Capital Effectively
What are the early trends we should look for to identify a stock that could multiply in value over the long term? One common approach is to try and find a company with returns on capital employed (ROCE) that are increasing, in conjunction with a growing amount of capital employed. This shows us that it's a compounding machine, able to continually reinvest its earnings back into the business and generate higher returns. In light of that, when we looked at LPA Group (LON:LPA) and its ROCE trend, we weren't exactly thrilled.
What Is Return On Capital Employed (ROCE)?
Just to clarify if you're unsure, ROCE is a metric for evaluating how much pre-tax income (in percentage terms) a company earns on the capital invested in its business. To calculate this metric for LPA Group, this is the formula:
Return on Capital Employed = Earnings Before Interest and Tax (EBIT) ÷ (Total Assets - Current Liabilities)
0.0087 = UK£165k ÷ (UK£25m - UK£6.1m) (Based on the trailing twelve months to March 2024).
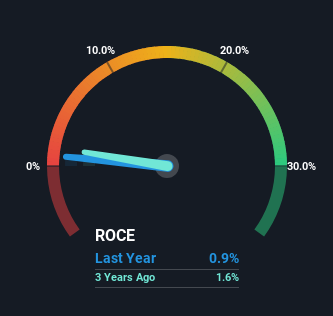
Thus, LPA Group has an ROCE of 0.9%. In absolute terms, that's a low return and it also under-performs the Electrical industry average of 9.8%.
View our latest analysis for LPA Group
In the above chart we have measured LPA Group's prior ROCE against its prior performance, but the future is arguably more important. If you'd like to see what analysts are forecasting going forward, you should check out our free analyst report for LPA Group .
How Are Returns Trending?
When we looked at the ROCE trend at LPA Group, we didn't gain much confidence. Over the last five years, returns on capital have decreased to 0.9% from 9.0% five years ago. Although, given both revenue and the amount of assets employed in the business have increased, it could suggest the company is investing in growth, and the extra capital has led to a short-term reduction in ROCE. If these investments prove successful, this can bode very well for long term stock performance.
The Bottom Line On LPA Group's ROCE
While returns have fallen for LPA Group in recent times, we're encouraged to see that sales are growing and that the business is reinvesting in its operations. And there could be an opportunity here if other metrics look good too, because the stock has declined 29% in the last five years. So we think it'd be worthwhile to look further into this stock given the trends look encouraging.
On a final note, we've found 2 warning signs for LPA Group that we think you should be aware of.
For those who like to invest in solid companies, check out this free list of companies with solid balance sheets and high returns on equity.
Have feedback on this article? Concerned about the content? Get in touch with us directly. Alternatively, email editorial-team (at) simplywallst.com.
This article by Simply Wall St is general in nature. We provide commentary based on historical data and analyst forecasts only using an unbiased methodology and our articles are not intended to be financial advice. It does not constitute a recommendation to buy or sell any stock, and does not take account of your objectives, or your financial situation. We aim to bring you long-term focused analysis driven by fundamental data. Note that our analysis may not factor in the latest price-sensitive company announcements or qualitative material. Simply Wall St has no position in any stocks mentioned.
Have feedback on this article? Concerned about the content? Get in touch with us directly. Alternatively, email editorial-team@simplywallst.com
