
 Yahoo Finance
 Performant Financial (NASDAQ:PFMT) shareholders have earned a 16% CAGR over the last five years
Performant Financial Corporation (NASDAQ:PFMT) shareholders might be concerned after seeing the share price drop 16% in the last month. But in stark contrast, the returns over the last half decade have impressed. We think most investors would be happy with the 106% return, over that period. So while it's never fun to see a share price fall, it's important to look at a longer time horizon. Only time will tell if there is still too much optimism currently reflected in the share price.
So let's assess the underlying fundamentals over the last 5 years and see if they've moved in lock-step with shareholder returns.
See our latest analysis for Performant Financial
Because Performant Financial made a loss in the last twelve months, we think the market is probably more focussed on revenue and revenue growth, at least for now. Shareholders of unprofitable companies usually desire strong revenue growth. That's because it's hard to be confident a company will be sustainable if revenue growth is negligible, and it never makes a profit.
Over the last half decade Performant Financial's revenue has actually been trending down at about 7.7% per year. Given that scenario, we wouldn't have expected the share price to rise 16% per year, but that's what it did. It's a good reminder that expectations about the future, not the past history, always impact share prices. Still, we are a bit cautious in this kind of situation.
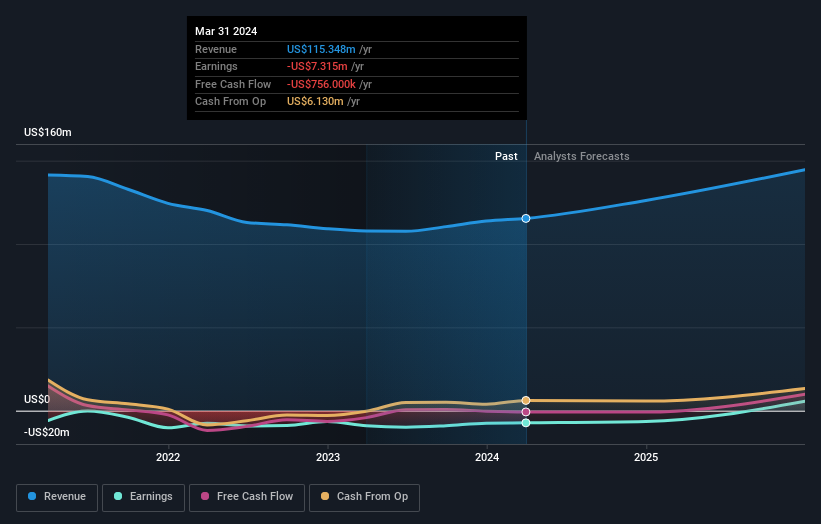
The image below shows how earnings and revenue have tracked over time (if you click on the image you can see greater detail).
Balance sheet strength is crucial. It might be well worthwhile taking a look at our free report on how its financial position has changed over time.
A Different Perspective
While the broader market gained around 24% in the last year, Performant Financial shareholders lost 2.6%. Even the share prices of good stocks drop sometimes, but we want to see improvements in the fundamental metrics of a business, before getting too interested. Longer term investors wouldn't be so upset, since they would have made 16%, each year, over five years. It could be that the recent sell-off is an opportunity, so it may be worth checking the fundamental data for signs of a long term growth trend. It's always interesting to track share price performance over the longer term. But to understand Performant Financial better, we need to consider many other factors. Case in point: We've spotted 1 warning sign for Performant Financial you should be aware of.
If you like to buy stocks alongside management, then you might just love this free list of companies. (Hint: many of them are unnoticed AND have attractive valuation).
Please note, the market returns quoted in this article reflect the market weighted average returns of stocks that currently trade on American exchanges.
Have feedback on this article? Concerned about the content? Get in touch with us directly. Alternatively, email editorial-team (at) simplywallst.com.
This article by Simply Wall St is general in nature. We provide commentary based on historical data and analyst forecasts only using an unbiased methodology and our articles are not intended to be financial advice. It does not constitute a recommendation to buy or sell any stock, and does not take account of your objectives, or your financial situation. We aim to bring you long-term focused analysis driven by fundamental data. Note that our analysis may not factor in the latest price-sensitive company announcements or qualitative material. Simply Wall St has no position in any stocks mentioned.
Have feedback on this article? Concerned about the content? Get in touch with us directly. Alternatively, email editorial-team@simplywallst.com
