
 Yahoo Finance
 Philip Morris International's (NYSE:PM) investors will be pleased with their favorable 55% return over the last three years
Low-cost index funds make it easy to achieve average market returns. But if you invest in individual stocks, some are likely to underperform. For example, the Philip Morris International Inc. (NYSE:PM) share price return of 31% over three years lags the market return in the same period. Unfortunately, the share price has fallen 0.6% over twelve months.
With that in mind, it's worth seeing if the company's underlying fundamentals have been the driver of long term performance, or if there are some discrepancies.
Check out our latest analysis for Philip Morris International
While the efficient markets hypothesis continues to be taught by some, it has been proven that markets are over-reactive dynamic systems, and investors are not always rational. By comparing earnings per share (EPS) and share price changes over time, we can get a feel for how investor attitudes to a company have morphed over time.
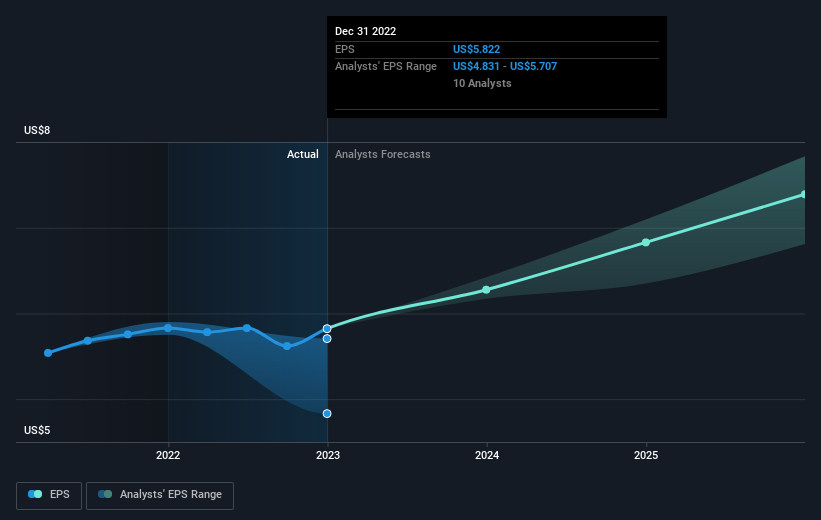
During three years of share price growth, Philip Morris International achieved compound earnings per share growth of 8.0% per year. We note that the 10% yearly (average) share price gain isn't too far from the EPS growth rate. Coincidence? Probably not. That suggests that the market sentiment around the company hasn't changed much over that time. Quite to the contrary, the share price has arguably reflected the EPS growth.
The image below shows how EPS has tracked over time (if you click on the image you can see greater detail).
This free interactive report on Philip Morris International's earnings, revenue and cash flow is a great place to start, if you want to investigate the stock further.
What About Dividends?
It is important to consider the total shareholder return, as well as the share price return, for any given stock. The TSR is a return calculation that accounts for the value of cash dividends (assuming that any dividend received was reinvested) and the calculated value of any discounted capital raisings and spin-offs. Arguably, the TSR gives a more comprehensive picture of the return generated by a stock. We note that for Philip Morris International the TSR over the last 3 years was 55%, which is better than the share price return mentioned above. The dividends paid by the company have thusly boosted the total shareholder return.
A Different Perspective
It's good to see that Philip Morris International has rewarded shareholders with a total shareholder return of 4.7% in the last twelve months. And that does include the dividend. However, the TSR over five years, coming in at 6% per year, is even more impressive. While it is well worth considering the different impacts that market conditions can have on the share price, there are other factors that are even more important. Even so, be aware that Philip Morris International is showing 2 warning signs in our investment analysis , you should know about...
Of course, you might find a fantastic investment by looking elsewhere. So take a peek at this free list of companies we expect will grow earnings.
Please note, the market returns quoted in this article reflect the market weighted average returns of stocks that currently trade on American exchanges.
Have feedback on this article? Concerned about the content? Get in touch with us directly. Alternatively, email editorial-team (at) simplywallst.com.
This article by Simply Wall St is general in nature. We provide commentary based on historical data and analyst forecasts only using an unbiased methodology and our articles are not intended to be financial advice. It does not constitute a recommendation to buy or sell any stock, and does not take account of your objectives, or your financial situation. We aim to bring you long-term focused analysis driven by fundamental data. Note that our analysis may not factor in the latest price-sensitive company announcements or qualitative material. Simply Wall St has no position in any stocks mentioned.
Join A Paid User Research Session
You’ll receive a US$30 Amazon Gift card for 1 hour of your time while helping us build better investing tools for the individual investors like yourself. Sign up here
