
 Yahoo Finance
 Returns On Capital Are Showing Encouraging Signs At Flotek Industries (NYSE:FTK)
To find a multi-bagger stock, what are the underlying trends we should look for in a business? In a perfect world, we'd like to see a company investing more capital into its business and ideally the returns earned from that capital are also increasing. This shows us that it's a compounding machine, able to continually reinvest its earnings back into the business and generate higher returns. With that in mind, we've noticed some promising trends at Flotek Industries (NYSE:FTK) so let's look a bit deeper.
Return On Capital Employed (ROCE): What Is It?
For those that aren't sure what ROCE is, it measures the amount of pre-tax profits a company can generate from the capital employed in its business. To calculate this metric for Flotek Industries, this is the formula:
Return on Capital Employed = Earnings Before Interest and Tax (EBIT) ÷ (Total Assets - Current Liabilities)
0.0058 = US$642k ÷ (US$156m - US$45m) (Based on the trailing twelve months to March 2024).
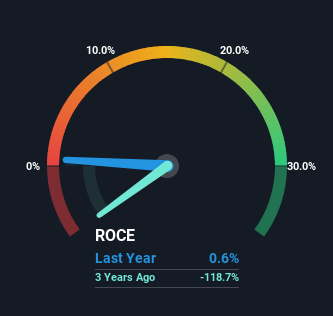
Therefore, Flotek Industries has an ROCE of 0.6%. In absolute terms, that's a low return and it also under-performs the Chemicals industry average of 8.8%.
View our latest analysis for Flotek Industries
Above you can see how the current ROCE for Flotek Industries compares to its prior returns on capital, but there's only so much you can tell from the past. If you'd like, you can check out the forecasts from the analysts covering Flotek Industries for free.
The Trend Of ROCE
It's great to see that Flotek Industries has started to generate some pre-tax earnings from prior investments. Historically the company was generating losses but as we can see from the latest figures referenced above, they're now earning 0.6% on their capital employed. In regards to capital employed, Flotek Industries is using 56% less capital than it was five years ago, which on the surface, can indicate that the business has become more efficient at generating these returns. The reduction could indicate that the company is selling some assets, and considering returns are up, they appear to be selling the right ones.
For the record though, there was a noticeable increase in the company's current liabilities over the period, so we would attribute some of the ROCE growth to that. Essentially the business now has suppliers or short-term creditors funding about 29% of its operations, which isn't ideal. It's worth keeping an eye on this because as the percentage of current liabilities to total assets increases, some aspects of risk also increase.
Our Take On Flotek Industries' ROCE
From what we've seen above, Flotek Industries has managed to increase it's returns on capital all the while reducing it's capital base. Although the company may be facing some issues elsewhere since the stock has plunged 78% in the last five years. Still, it's worth doing some further research to see if the trends will continue into the future.
Flotek Industries does come with some risks though, we found 3 warning signs in our investment analysis, and 2 of those are significant...
For those who like to invest in solid companies, check out this free list of companies with solid balance sheets and high returns on equity.
Have feedback on this article? Concerned about the content? Get in touch with us directly. Alternatively, email editorial-team (at) simplywallst.com.
This article by Simply Wall St is general in nature. We provide commentary based on historical data and analyst forecasts only using an unbiased methodology and our articles are not intended to be financial advice. It does not constitute a recommendation to buy or sell any stock, and does not take account of your objectives, or your financial situation. We aim to bring you long-term focused analysis driven by fundamental data. Note that our analysis may not factor in the latest price-sensitive company announcements or qualitative material. Simply Wall St has no position in any stocks mentioned.
Have feedback on this article? Concerned about the content? Get in touch with us directly. Alternatively, email editorial-team@simplywallst.com
