
 Yahoo Finance
 Sainsbury (J) PLC's Dividend Analysis
Exploring the Sustainability and Prospects of Sainsbury (J) PLC's Dividends
Sainsbury (J) PLC (JSNSF) recently announced a dividend of $0.09 per share, payable on 2024-07-12, with the ex-dividend date set for 2024-06-06. As investors look forward to this upcoming payment, the spotlight also shines on the company's dividend history, yield, and growth rates. Using the data from GuruFocus, let's look into Sainsbury (J) PLC's dividend performance and assess its sustainability.
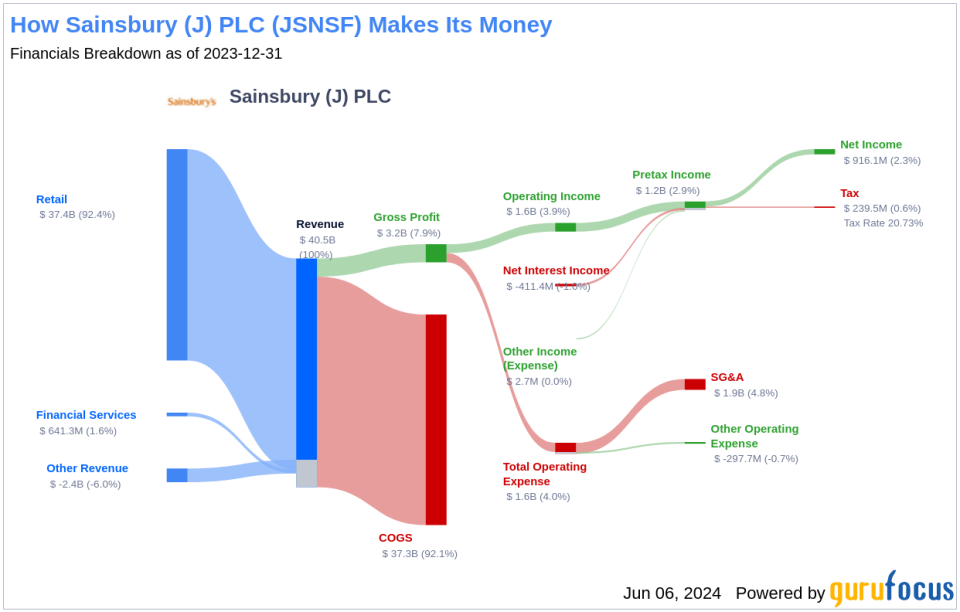
What Does Sainsbury (J) PLC Do?
This Powerful Chart Made Peter Lynch 29% A Year For 13 Years
How to calculate the intrinsic value of a stock?
Founded in 1869, Sainsbury's is the second-largest U.K. grocery chain with around 16% market share. It operates around 600 supermarkets and 800 convenience stores, all in the U.K. The company has diversified away from core food by selling clothing, telecom equipment, and other nonfood items. In September 2016, it took a step further into nonfood retailing with the purchase of Home Retail Group, operating the Habitat and Argos chains (general merchandise and electronics stores), for GBP 1.10 billion. It has been selling products online since 1997.
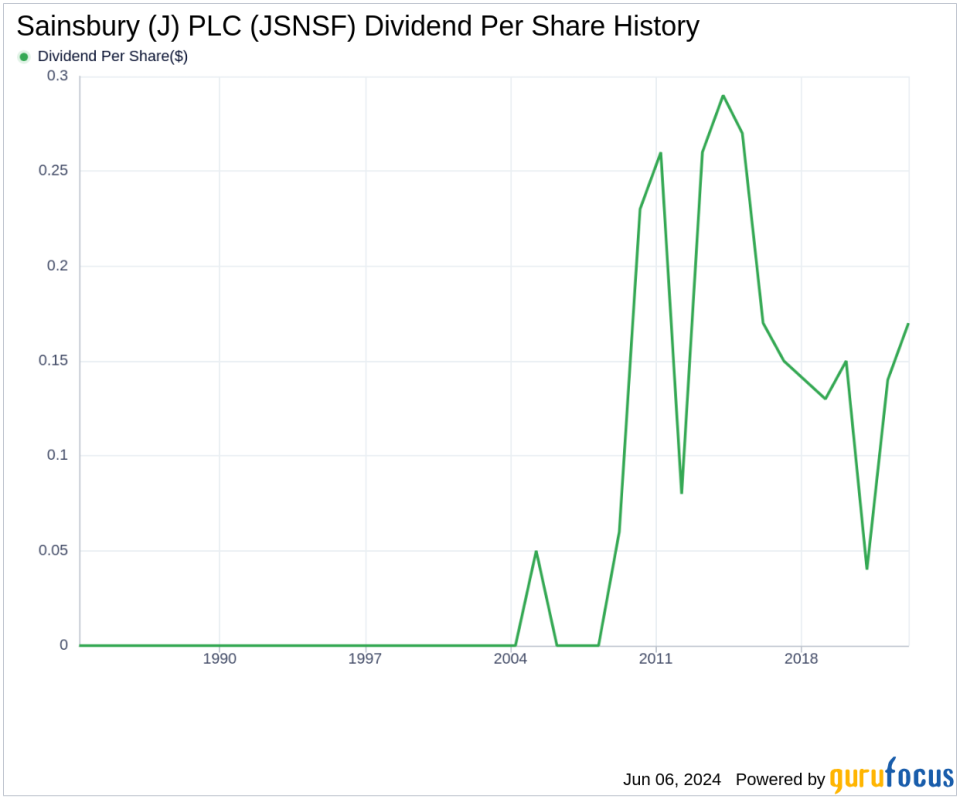
A Glimpse at Sainsbury (J) PLC's Dividend History
Sainsbury (J) PLC has maintained a consistent dividend payment record since 2008. Dividends are currently distributed on a bi-annually basis. Below is a chart showing annual Dividends Per Share for tracking historical trends.
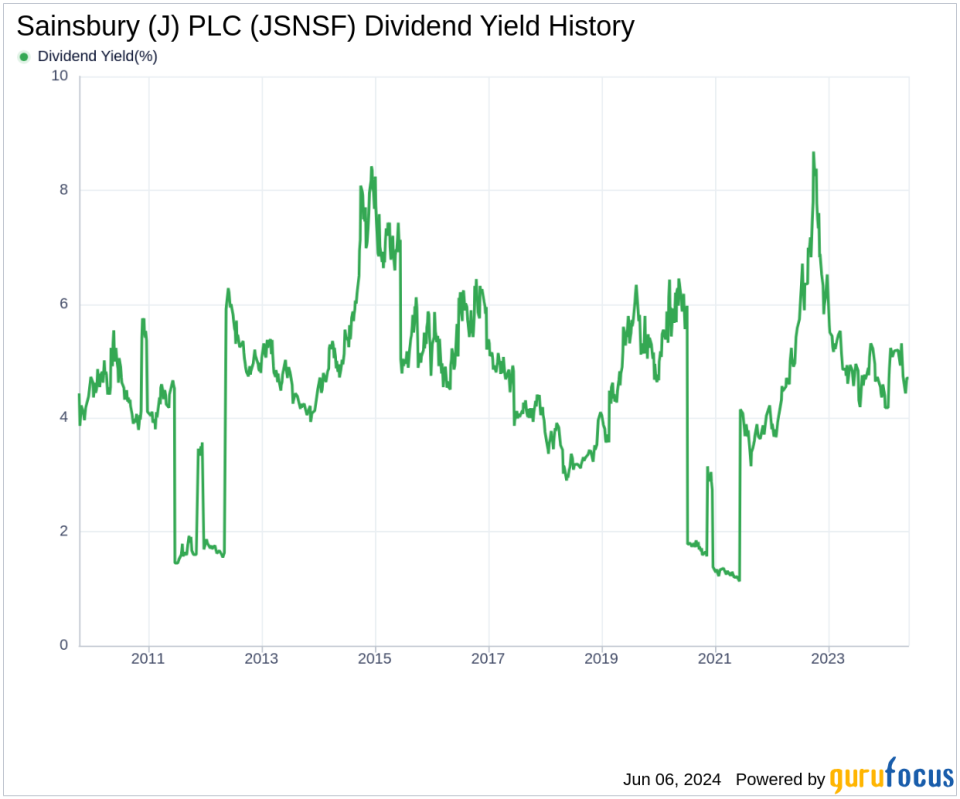
Breaking Down Sainsbury (J) PLC's Dividend Yield and Growth
As of today, Sainsbury (J) PLC currently has a 12-month trailing dividend yield of 4.87% and a 12-month forward dividend yield of 4.70%. This suggests an expectation of decreased dividend payments over the next 12 months. Over the past three years, Sainsbury (J) PLC's annual dividend growth rate was 7.20%. Extended to a five-year horizon, this rate decreased to 1.80% per year. And over the past decade, Sainsbury (J) PLC's annual dividends per share growth rate stands at -7.10%.
Based on Sainsbury (J) PLC's dividend yield and five-year growth rate, the 5-year yield on cost of Sainsbury (J) PLC stock as of today is approximately 5.32%.
The Sustainability Question: Payout Ratio and Profitability
To assess the sustainability of the dividend, one needs to evaluate the company's payout ratio. The dividend payout ratio provides insights into the portion of earnings the company distributes as dividends. A lower ratio suggests that the company retains a significant part of its earnings, thereby ensuring the availability of funds for future growth and unexpected downturns. As of 2024-02-29, Sainsbury (J) PLC's dividend payout ratio is 0.61.
Sainsbury (J) PLC's profitability rank, offers an understanding of the company's earnings prowess relative to its peers. GuruFocus ranks Sainsbury (J) PLC's profitability 5 out of 10 as of 2024-02-29, suggesting fair profitability. The company has reported net profit in 8 years out of past 10 years.
Growth Metrics: The Future Outlook
To ensure the sustainability of dividends, a company must have robust growth metrics. Sainsbury (J) PLC's growth rank of 5 out of 10 suggests that the company has a fair growth outlook. Revenue is the lifeblood of any company, and Sainsbury (J) PLC's revenue per share, combined with the 3-year revenue growth rate, indicates a strong revenue model. Sainsbury (J) PLC's revenue has increased by approximately 4.50% per year on average, a rate that underperforms than approximately 55.44% of global competitors.
The company's 3-year EPS growth rate showcases its capability to grow its earnings, a critical component for sustaining dividends in the long run. During the past three years, Sainsbury (J) PLC's earnings increased by approximately 7.40% per year on average, a rate that underperforms than approximately 48.07% of global competitors.
Lastly, the company's 5-year EBITDA growth rate of 3.30%, which underperforms than approximately 73.21% of global competitors.
Next Steps
Given Sainsbury (J) PLC's dividend payments, growth rate, payout ratio, profitability, and growth metrics, investors should consider these factors when evaluating the stock's potential for long-term dividend income. GuruFocus Premium users can screen for high-dividend yield stocks using the High Dividend Yield Screener.
This article, generated by GuruFocus, is designed to provide general insights and is not tailored financial advice. Our commentary is rooted in historical data and analyst projections, utilizing an impartial methodology, and is not intended to serve as specific investment guidance. It does not formulate a recommendation to purchase or divest any stock and does not consider individual investment objectives or financial circumstances. Our objective is to deliver long-term, fundamental data-driven analysis. Be aware that our analysis might not incorporate the most recent, price-sensitive company announcements or qualitative information. GuruFocus holds no position in the stocks mentioned herein.
This article first appeared on GuruFocus.
