
 Yahoo Finance
 Shareholders in RMR Group (NASDAQ:RMR) are in the red if they invested five years ago
For many, the main point of investing is to generate higher returns than the overall market. But the main game is to find enough winners to more than offset the losers So we wouldn't blame long term The RMR Group Inc. (NASDAQ:RMR) shareholders for doubting their decision to hold, with the stock down 55% over a half decade.
So let's have a look and see if the longer term performance of the company has been in line with the underlying business' progress.
See our latest analysis for RMR Group
In his essay The Superinvestors of Graham-and-Doddsville Warren Buffett described how share prices do not always rationally reflect the value of a business. One imperfect but simple way to consider how the market perception of a company has shifted is to compare the change in the earnings per share (EPS) with the share price movement.
Looking back five years, both RMR Group's share price and EPS declined; the latter at a rate of 11% per year. This reduction in EPS is less than the 15% annual reduction in the share price. This implies that the market was previously too optimistic about the stock. The low P/E ratio of 8.48 further reflects this reticence.
You can see below how EPS has changed over time (discover the exact values by clicking on the image).
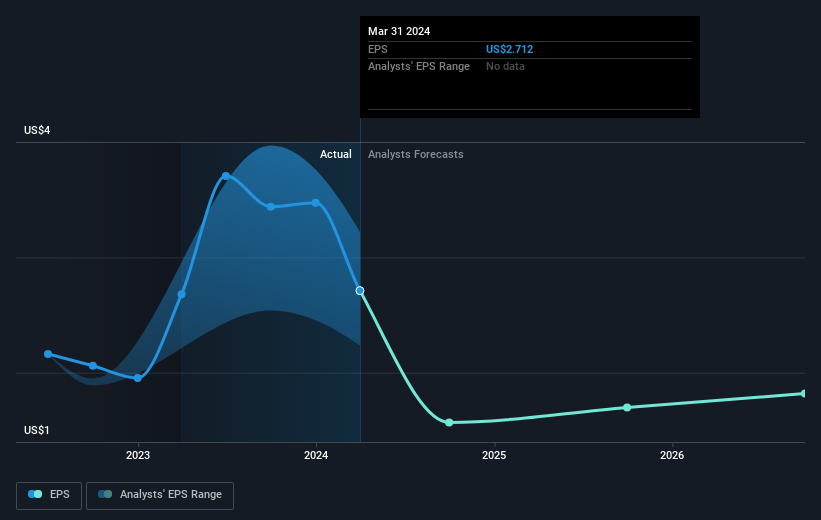
Before buying or selling a stock, we always recommend a close examination of historic growth trends, available here.
What About Dividends?
It is important to consider the total shareholder return, as well as the share price return, for any given stock. The TSR incorporates the value of any spin-offs or discounted capital raisings, along with any dividends, based on the assumption that the dividends are reinvested. It's fair to say that the TSR gives a more complete picture for stocks that pay a dividend. In the case of RMR Group, it has a TSR of -31% for the last 5 years. That exceeds its share price return that we previously mentioned. This is largely a result of its dividend payments!
A Different Perspective
RMR Group shareholders gained a total return of 2.4% during the year. But that return falls short of the market. On the bright side, that's still a gain, and it is certainly better than the yearly loss of about 6% endured over half a decade. So this might be a sign the business has turned its fortunes around. While it is well worth considering the different impacts that market conditions can have on the share price, there are other factors that are even more important. For example, we've discovered 2 warning signs for RMR Group (1 doesn't sit too well with us!) that you should be aware of before investing here.
We will like RMR Group better if we see some big insider buys. While we wait, check out this free list of undervalued stocks (mostly small caps) with considerable, recent, insider buying.
Please note, the market returns quoted in this article reflect the market weighted average returns of stocks that currently trade on American exchanges.
Have feedback on this article? Concerned about the content? Get in touch with us directly. Alternatively, email editorial-team (at) simplywallst.com.
This article by Simply Wall St is general in nature. We provide commentary based on historical data and analyst forecasts only using an unbiased methodology and our articles are not intended to be financial advice. It does not constitute a recommendation to buy or sell any stock, and does not take account of your objectives, or your financial situation. We aim to bring you long-term focused analysis driven by fundamental data. Note that our analysis may not factor in the latest price-sensitive company announcements or qualitative material. Simply Wall St has no position in any stocks mentioned.
Have feedback on this article? Concerned about the content? Get in touch with us directly. Alternatively, email editorial-team@simplywallst.com
