
 Yahoo Finance
 Shareholders in Yum China Holdings (NYSE:YUMC) are in the red if they invested three years ago
If you are building a properly diversified stock portfolio, the chances are some of your picks will perform badly. But the last three years have been particularly tough on longer term Yum China Holdings, Inc. (NYSE:YUMC) shareholders. Regrettably, they have had to cope with a 53% drop in the share price over that period. And over the last year the share price fell 44%, so we doubt many shareholders are delighted. The falls have accelerated recently, with the share price down 21% in the last three months.
Now let's have a look at the company's fundamentals, and see if the long term shareholder return has matched the performance of the underlying business.
Check out our latest analysis for Yum China Holdings
In his essay The Superinvestors of Graham-and-Doddsville Warren Buffett described how share prices do not always rationally reflect the value of a business. By comparing earnings per share (EPS) and share price changes over time, we can get a feel for how investor attitudes to a company have morphed over time.
Yum China Holdings saw its EPS decline at a compound rate of 3.5% per year, over the last three years. This reduction in EPS is slower than the 22% annual reduction in the share price. So it's likely that the EPS decline has disappointed the market, leaving investors hesitant to buy.
You can see how EPS has changed over time in the image below (click on the chart to see the exact values).
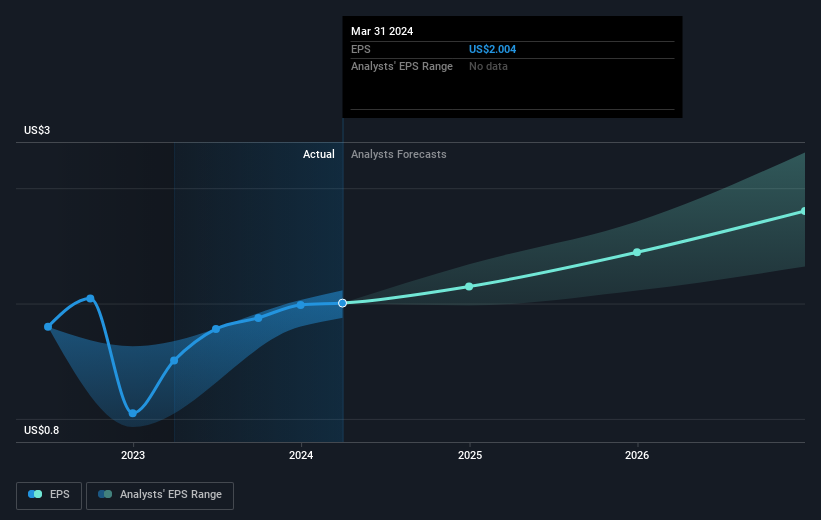
We like that insiders have been buying shares in the last twelve months. Even so, future earnings will be far more important to whether current shareholders make money. Dive deeper into the earnings by checking this interactive graph of Yum China Holdings' earnings, revenue and cash flow.
A Different Perspective
Yum China Holdings shareholders are down 44% for the year (even including dividends), but the market itself is up 25%. Even the share prices of good stocks drop sometimes, but we want to see improvements in the fundamental metrics of a business, before getting too interested. Unfortunately, last year's performance may indicate unresolved challenges, given that it was worse than the annualised loss of 5% over the last half decade. Generally speaking long term share price weakness can be a bad sign, though contrarian investors might want to research the stock in hope of a turnaround. While it is well worth considering the different impacts that market conditions can have on the share price, there are other factors that are even more important. Take risks, for example - Yum China Holdings has 1 warning sign we think you should be aware of.
Yum China Holdings is not the only stock that insiders are buying. For those who like to find lesser know companies this free list of growing companies with recent insider purchasing, could be just the ticket.
Please note, the market returns quoted in this article reflect the market weighted average returns of stocks that currently trade on American exchanges.
Have feedback on this article? Concerned about the content? Get in touch with us directly. Alternatively, email editorial-team (at) simplywallst.com.
This article by Simply Wall St is general in nature. We provide commentary based on historical data and analyst forecasts only using an unbiased methodology and our articles are not intended to be financial advice. It does not constitute a recommendation to buy or sell any stock, and does not take account of your objectives, or your financial situation. We aim to bring you long-term focused analysis driven by fundamental data. Note that our analysis may not factor in the latest price-sensitive company announcements or qualitative material. Simply Wall St has no position in any stocks mentioned.
Have feedback on this article? Concerned about the content? Get in touch with us directly. Alternatively, email editorial-team@simplywallst.com
