
 Yahoo Finance
 Three Growth Companies On Chinese Exchange With High Insider Ownership And Up To 28% Revenue Growth
Amid a backdrop of modest declines in Chinese stock indices and ongoing economic concerns, investors are increasingly attentive to opportunities that might defy broader market trends. Companies with high insider ownership and robust revenue growth, such as the three highlighted in this article, can offer a compelling narrative of commitment and confidence in their future prospects within such challenging environments.
Top 10 Growth Companies With High Insider Ownership In China
Name | Insider Ownership | Earnings Growth |
Zhejiang Jolly PharmaceuticalLTD (SZSE:300181) | 24% | 22.3% |
KEBODA TECHNOLOGY (SHSE:603786) | 12.8% | 25.1% |
Sineng ElectricLtd (SZSE:300827) | 36.5% | 39.8% |
Cubic Sensor and InstrumentLtd (SHSE:688665) | 10.1% | 34.3% |
Arctech Solar Holding (SHSE:688408) | 38.6% | 25.8% |
Suzhou Sunmun Technology (SZSE:300522) | 36.5% | 63.4% |
Anhui Huaheng Biotechnology (SHSE:688639) | 31.5% | 28.4% |
Fujian Wanchen Biotechnology Group (SZSE:300972) | 14.9% | 75.9% |
UTour Group (SZSE:002707) | 23% | 33.1% |
Xi'an Sinofuse Electric (SZSE:301031) | 36.8% | 43.1% |
Here we highlight a subset of our preferred stocks from the screener.
Inner Mongolia Furui Medical Science
Simply Wall St Growth Rating: ★★★★★☆
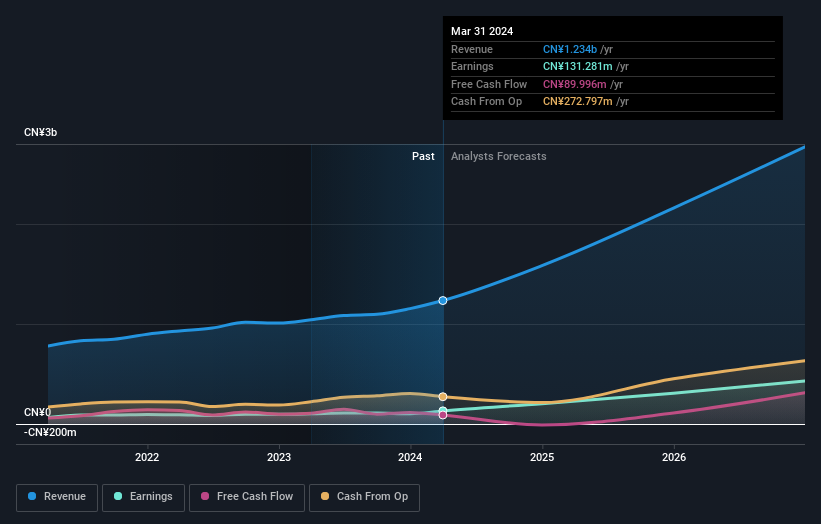
Overview: Inner Mongolia Furui Medical Science Co., Ltd. operates in the healthcare sector and has a market capitalization of approximately CN¥14.20 billion.
Operations: The company generates revenue through its operations in the healthcare sector.
Insider Ownership: 18.2%
Revenue Growth Forecast: 28.9% p.a.
Inner Mongolia Furui Medical Science has shown robust growth, with a 28.4% increase in earnings over the past year and significant future potential indicated by forecasts of 40.5% annual profit growth and 28.9% revenue growth, both outpacing market averages. Recent changes to company bylaws and approval of a revised restricted stock incentive plan signal proactive governance adjustments aligning with its aggressive growth strategy. However, its Return on Equity is expected to remain low at 17.5%, highlighting some efficiency challenges despite strong top-line metrics.
Hubei DinglongLtd
Simply Wall St Growth Rating: ★★★★☆☆
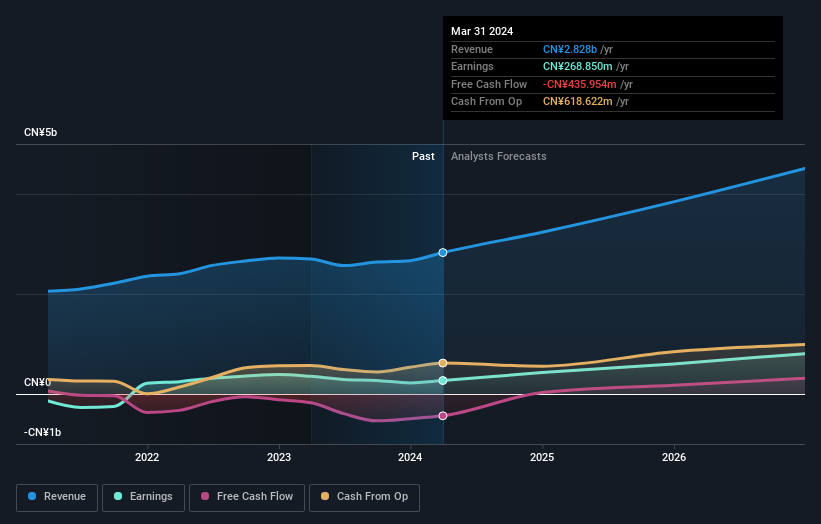
Overview: Hubei Dinglong Co., Ltd. operates in the field of integrated circuit chip design, semiconductor process materials, advanced semiconductor packaging materials, semiconductor display materials, and printing and copying consumables, with a market capitalization of CN¥20.96 billion.
Operations: The company's revenue is primarily generated from the photoelectric imaging display and semiconductor process materials industry, totaling CN¥2.80 billion.
Insider Ownership: 29.8%
Revenue Growth Forecast: 16.8% p.a.
Hubei Dinglong CO.,Ltd. is trading at 11.6% below its estimated fair value, signaling potential underpricing. The company's revenue growth is projected at 16.8% annually, surpassing the Chinese market average of 13.7%. Furthermore, earnings are expected to increase by a significant 36.4% per year over the next three years, outperforming the market forecast of 22.2%. However, its Return on Equity is anticipated to be modest at 11.9%. Recent amendments to corporate bylaws and strong quarterly results underscore proactive management and solid financial performance.
Dive into the specifics of Hubei DinglongLtd here with our thorough growth forecast report.
Our expertly prepared valuation report Hubei DinglongLtd implies its share price may be too high.
Zhejiang Jolly PharmaceuticalLTD
Simply Wall St Growth Rating: ★★★★★★
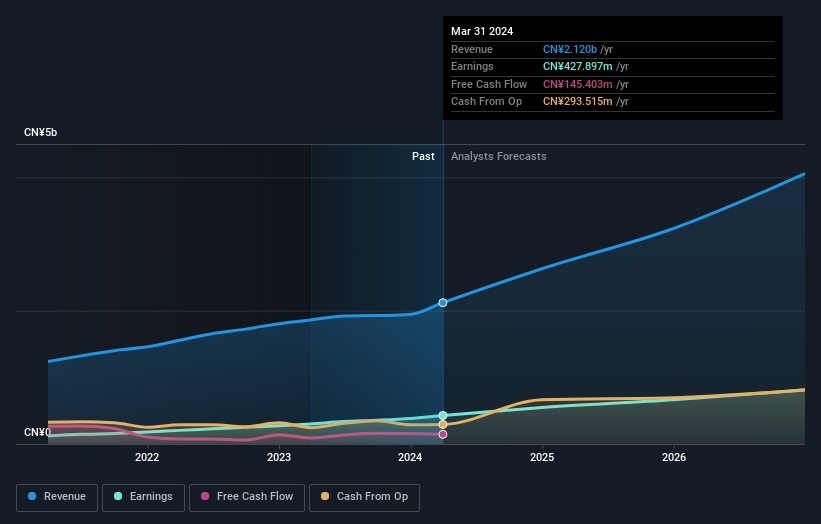
Overview: Zhejiang Jolly Pharmaceutical Co., LTD focuses on researching, producing, and marketing Chinese medicinal products both domestically in the People's Republic of China and internationally, with a market capitalization of approximately CN¥11.07 billion.
Operations: The company primarily generates revenue from the research, production, and marketing of Chinese medicinal products.
Insider Ownership: 24%
Revenue Growth Forecast: 23.1% p.a.
Zhejiang Jolly Pharmaceutical Co.,LTD has demonstrated robust financial growth, with a significant increase in quarterly sales and net income. The company's revenue and earnings are expected to grow by 23.1% and 22.31% per year respectively, outpacing the Chinese market forecasts. Despite this, its dividend coverage is weak, raising concerns about sustainability. Recent corporate activities include a sizeable private placement and amendments to bylaws, indicating active management engagement and strategic planning for future growth.
Key Takeaways
Explore the 368 names from our Fast Growing Chinese Companies With High Insider Ownership screener here.
Invested in any of these stocks? Simplify your portfolio management with Simply Wall St and stay ahead with our alerts for any critical updates on your stocks.
Unlock the power of informed investing with Simply Wall St, your free guide to navigating stock markets worldwide.
Interested In Other Possibilities?
Explore high-performing small cap companies that haven't yet garnered significant analyst attention.
Diversify your portfolio with solid dividend payers offering reliable income streams to weather potential market turbulence.
Find companies with promising cash flow potential yet trading below their fair value.
This article by Simply Wall St is general in nature. We provide commentary based on historical data and analyst forecasts only using an unbiased methodology and our articles are not intended to be financial advice. It does not constitute a recommendation to buy or sell any stock, and does not take account of your objectives, or your financial situation. We aim to bring you long-term focused analysis driven by fundamental data. Note that our analysis may not factor in the latest price-sensitive company announcements or qualitative material. Simply Wall St has no position in any stocks mentioned.The analysis only considers stock directly held by insiders. It does not include indirectly owned stock through other vehicles such as corporate and/or trust entities. All forecast revenue and earnings growth rates quoted are in terms of annualised (per annum) growth rates over 1-3 years.
Companies discussed in this article include SZSE:300049 SZSE:300054 and SZSE:300181.
Have feedback on this article? Concerned about the content? Get in touch with us directly. Alternatively, email editorial-team@simplywallst.com
