
 Yahoo Finance
 The three-year returns for GrainCorp's (ASX:GNC) shareholders have been strong, yet its earnings growth was even better
One simple way to benefit from the stock market is to buy an index fund. But if you pick the right individual stocks, you could make more than that. For example, GrainCorp Limited (ASX:GNC) shareholders have seen the share price rise 74% over three years, well in excess of the market return (7.9%, not including dividends). However, more recent returns haven't been as impressive as that, with the stock returning just 16% in the last year, including dividends.
The past week has proven to be lucrative for GrainCorp investors, so let's see if fundamentals drove the company's three-year performance.
Check out our latest analysis for GrainCorp
There is no denying that markets are sometimes efficient, but prices do not always reflect underlying business performance. By comparing earnings per share (EPS) and share price changes over time, we can get a feel for how investor attitudes to a company have morphed over time.
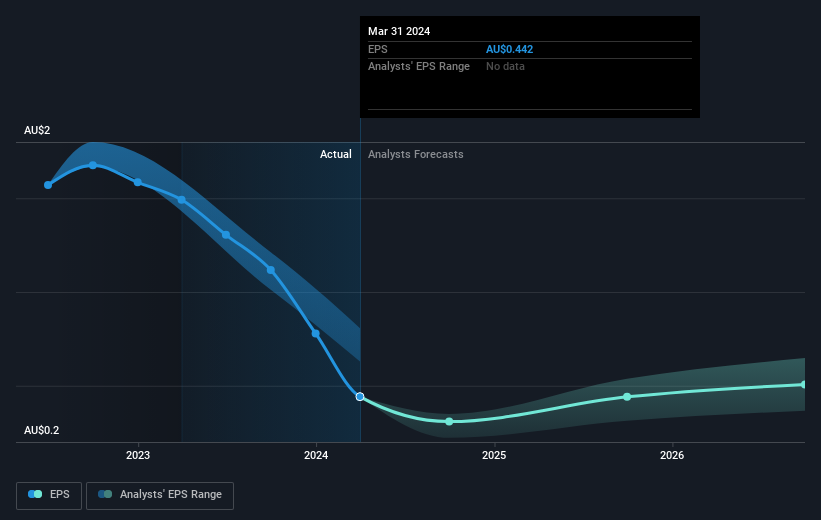
During three years of share price growth, GrainCorp achieved compound earnings per share growth of 134% per year. This EPS growth is higher than the 20% average annual increase in the share price. So it seems investors have become more cautious about the company, over time.
The image below shows how EPS has tracked over time (if you click on the image you can see greater detail).
It is of course excellent to see how GrainCorp has grown profits over the years, but the future is more important for shareholders. It might be well worthwhile taking a look at our free report on how its financial position has changed over time.
What About Dividends?
When looking at investment returns, it is important to consider the difference between total shareholder return (TSR) and share price return. The TSR incorporates the value of any spin-offs or discounted capital raisings, along with any dividends, based on the assumption that the dividends are reinvested. So for companies that pay a generous dividend, the TSR is often a lot higher than the share price return. In the case of GrainCorp, it has a TSR of 105% for the last 3 years. That exceeds its share price return that we previously mentioned. This is largely a result of its dividend payments!
A Different Perspective
It's good to see that GrainCorp has rewarded shareholders with a total shareholder return of 16% in the last twelve months. And that does include the dividend. However, the TSR over five years, coming in at 21% per year, is even more impressive. I find it very interesting to look at share price over the long term as a proxy for business performance. But to truly gain insight, we need to consider other information, too. Like risks, for instance. Every company has them, and we've spotted 3 warning signs for GrainCorp (of which 1 is potentially serious!) you should know about.
For those who like to find winning investments this free list of undervalued companies with recent insider purchasing, could be just the ticket.
Please note, the market returns quoted in this article reflect the market weighted average returns of stocks that currently trade on Australian exchanges.
Have feedback on this article? Concerned about the content? Get in touch with us directly. Alternatively, email editorial-team (at) simplywallst.com.
This article by Simply Wall St is general in nature. We provide commentary based on historical data and analyst forecasts only using an unbiased methodology and our articles are not intended to be financial advice. It does not constitute a recommendation to buy or sell any stock, and does not take account of your objectives, or your financial situation. We aim to bring you long-term focused analysis driven by fundamental data. Note that our analysis may not factor in the latest price-sensitive company announcements or qualitative material. Simply Wall St has no position in any stocks mentioned.
