
 Yahoo Finance
 The Trade Desk, Inc.'s (NASDAQ:TTD) Stock Is Rallying But Financials Look Ambiguous: Will The Momentum Continue?
Most readers would already be aware that Trade Desk's (NASDAQ:TTD) stock increased significantly by 18% over the past three months. But the company's key financial indicators appear to be differing across the board and that makes us question whether or not the company's current share price momentum can be maintained. Specifically, we decided to study Trade Desk's ROE in this article.
Return on equity or ROE is a key measure used to assess how efficiently a company's management is utilizing the company's capital. In other words, it is a profitability ratio which measures the rate of return on the capital provided by the company's shareholders.
View our latest analysis for Trade Desk
How Is ROE Calculated?
The formula for return on equity is:
Return on Equity = Net Profit (from continuing operations) ÷ Shareholders' Equity
So, based on the above formula, the ROE for Trade Desk is:
9.3% = US$201m ÷ US$2.2b (Based on the trailing twelve months to March 2024).
The 'return' is the income the business earned over the last year. So, this means that for every $1 of its shareholder's investments, the company generates a profit of $0.09.
What Is The Relationship Between ROE And Earnings Growth?
So far, we've learned that ROE is a measure of a company's profitability. We now need to evaluate how much profit the company reinvests or "retains" for future growth which then gives us an idea about the growth potential of the company. Generally speaking, other things being equal, firms with a high return on equity and profit retention, have a higher growth rate than firms that don’t share these attributes.
A Side By Side comparison of Trade Desk's Earnings Growth And 9.3% ROE
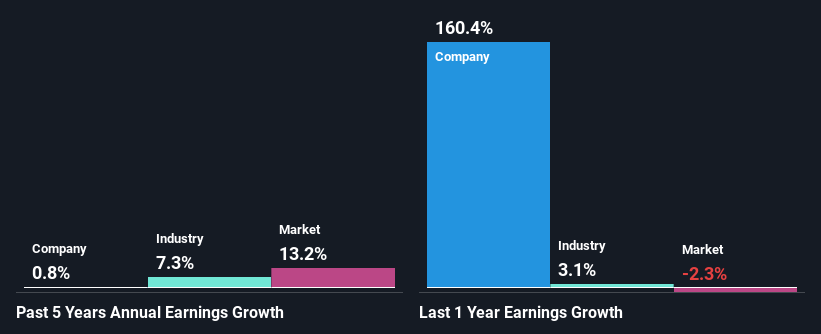
On the face of it, Trade Desk's ROE is not much to talk about. Next, when compared to the average industry ROE of 14%, the company's ROE leaves us feeling even less enthusiastic. As a result, Trade Desk's flat net income growth over the past five years doesn't come as a surprise given its lower ROE.
We then compared Trade Desk's net income growth with the industry and found that the company's growth figure is lower than the average industry growth rate of 7.3% in the same 5-year period, which is a bit concerning.
Earnings growth is an important metric to consider when valuing a stock. What investors need to determine next is if the expected earnings growth, or the lack of it, is already built into the share price. This then helps them determine if the stock is placed for a bright or bleak future. If you're wondering about Trade Desk's's valuation, check out this gauge of its price-to-earnings ratio, as compared to its industry.
Is Trade Desk Making Efficient Use Of Its Profits?
Trade Desk doesn't pay any regular dividends, meaning that the company is keeping all of its profits, which makes us wonder why it is retaining its earnings if it can't use them to grow its business. It looks like there might be some other reasons to explain the lack in that respect. For example, the business could be in decline.
Summary
On the whole, we feel that the performance shown by Trade Desk can be open to many interpretations. While the company does have a high rate of profit retention, its low rate of return is probably hampering its earnings growth. That being so, the latest analyst forecasts show that the company will continue to see an expansion in its earnings. To know more about the company's future earnings growth forecasts take a look at this free report on analyst forecasts for the company to find out more.
Have feedback on this article? Concerned about the content? Get in touch with us directly. Alternatively, email editorial-team (at) simplywallst.com.
This article by Simply Wall St is general in nature. We provide commentary based on historical data and analyst forecasts only using an unbiased methodology and our articles are not intended to be financial advice. It does not constitute a recommendation to buy or sell any stock, and does not take account of your objectives, or your financial situation. We aim to bring you long-term focused analysis driven by fundamental data. Note that our analysis may not factor in the latest price-sensitive company announcements or qualitative material. Simply Wall St has no position in any stocks mentioned.
Have feedback on this article? Concerned about the content? Get in touch with us directly. Alternatively, email editorial-team@simplywallst.com
