
 Yahoo Finance
 The Trend Of High Returns At Sociedad Química y Minera de Chile (NYSE:SQM) Has Us Very Interested
If you're not sure where to start when looking for the next multi-bagger, there are a few key trends you should keep an eye out for. Firstly, we'll want to see a proven return on capital employed (ROCE) that is increasing, and secondly, an expanding base of capital employed. Ultimately, this demonstrates that it's a business that is reinvesting profits at increasing rates of return. And in light of that, the trends we're seeing at Sociedad Química y Minera de Chile's (NYSE:SQM) look very promising so lets take a look.
Understanding Return On Capital Employed (ROCE)
For those who don't know, ROCE is a measure of a company's yearly pre-tax profit (its return), relative to the capital employed in the business. The formula for this calculation on Sociedad Química y Minera de Chile is:
Return on Capital Employed = Earnings Before Interest and Tax (EBIT) ÷ (Total Assets - Current Liabilities)
0.27 = US$2.2b ÷ (US$11b - US$2.4b) (Based on the trailing twelve months to March 2024).
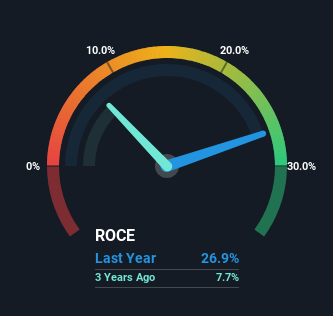
Thus, Sociedad Química y Minera de Chile has an ROCE of 27%. That's a fantastic return and not only that, it outpaces the average of 13% earned by companies in a similar industry.
View our latest analysis for Sociedad Química y Minera de Chile
In the above chart we have measured Sociedad Química y Minera de Chile's prior ROCE against its prior performance, but the future is arguably more important. If you're interested, you can view the analysts predictions in our free analyst report for Sociedad Química y Minera de Chile .
What Can We Tell From Sociedad Química y Minera de Chile's ROCE Trend?
We like the trends that we're seeing from Sociedad Química y Minera de Chile. The data shows that returns on capital have increased substantially over the last five years to 27%. Basically the business is earning more per dollar of capital invested and in addition to that, 119% more capital is being employed now too. This can indicate that there's plenty of opportunities to invest capital internally and at ever higher rates, a combination that's common among multi-baggers.
The Key Takeaway
All in all, it's terrific to see that Sociedad Química y Minera de Chile is reaping the rewards from prior investments and is growing its capital base. And with a respectable 71% awarded to those who held the stock over the last five years, you could argue that these developments are starting to get the attention they deserve. In light of that, we think it's worth looking further into this stock because if Sociedad Química y Minera de Chile can keep these trends up, it could have a bright future ahead.
One final note, you should learn about the 3 warning signs we've spotted with Sociedad Química y Minera de Chile (including 1 which can't be ignored) .
Sociedad Química y Minera de Chile is not the only stock earning high returns. If you'd like to see more, check out our free list of companies earning high returns on equity with solid fundamentals.
Have feedback on this article? Concerned about the content? Get in touch with us directly. Alternatively, email editorial-team (at) simplywallst.com.
This article by Simply Wall St is general in nature. We provide commentary based on historical data and analyst forecasts only using an unbiased methodology and our articles are not intended to be financial advice. It does not constitute a recommendation to buy or sell any stock, and does not take account of your objectives, or your financial situation. We aim to bring you long-term focused analysis driven by fundamental data. Note that our analysis may not factor in the latest price-sensitive company announcements or qualitative material. Simply Wall St has no position in any stocks mentioned.
