
 Yahoo Finance
 We Like These Underlying Return On Capital Trends At PBA Holdings Bhd (KLSE:PBA)
If you're not sure where to start when looking for the next multi-bagger, there are a few key trends you should keep an eye out for. One common approach is to try and find a company with returns on capital employed (ROCE) that are increasing, in conjunction with a growing amount of capital employed. If you see this, it typically means it's a company with a great business model and plenty of profitable reinvestment opportunities. So when we looked at PBA Holdings Bhd (KLSE:PBA) and its trend of ROCE, we really liked what we saw.
Return On Capital Employed (ROCE): What Is It?
Just to clarify if you're unsure, ROCE is a metric for evaluating how much pre-tax income (in percentage terms) a company earns on the capital invested in its business. Analysts use this formula to calculate it for PBA Holdings Bhd:
Return on Capital Employed = Earnings Before Interest and Tax (EBIT) ÷ (Total Assets - Current Liabilities)
0.06 = RM83m ÷ (RM1.6b - RM234m) (Based on the trailing twelve months to March 2024).
Thus, PBA Holdings Bhd has an ROCE of 6.0%. In absolute terms, that's a low return but it's around the Water Utilities industry average of 6.9%.
See our latest analysis for PBA Holdings Bhd
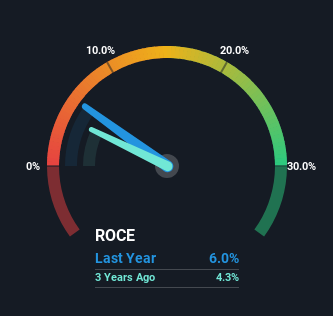
Historical performance is a great place to start when researching a stock so above you can see the gauge for PBA Holdings Bhd's ROCE against it's prior returns. If you want to delve into the historical earnings , check out these free graphs detailing revenue and cash flow performance of PBA Holdings Bhd.
What Can We Tell From PBA Holdings Bhd's ROCE Trend?
PBA Holdings Bhd has not disappointed with their ROCE growth. Looking at the data, we can see that even though capital employed in the business has remained relatively flat, the ROCE generated has risen by 173% over the last five years. Basically the business is generating higher returns from the same amount of capital and that is proof that there are improvements in the company's efficiencies. The company is doing well in that sense, and it's worth investigating what the management team has planned for long term growth prospects.
The Bottom Line On PBA Holdings Bhd's ROCE
In summary, we're delighted to see that PBA Holdings Bhd has been able to increase efficiencies and earn higher rates of return on the same amount of capital. And investors seem to expect more of this going forward, since the stock has rewarded shareholders with a 92% return over the last five years. Therefore, we think it would be worth your time to check if these trends are going to continue.
On a final note, we've found 2 warning signs for PBA Holdings Bhd that we think you should be aware of.
If you want to search for solid companies with great earnings, check out this free list of companies with good balance sheets and impressive returns on equity.
Have feedback on this article? Concerned about the content? Get in touch with us directly. Alternatively, email editorial-team (at) simplywallst.com.
This article by Simply Wall St is general in nature. We provide commentary based on historical data and analyst forecasts only using an unbiased methodology and our articles are not intended to be financial advice. It does not constitute a recommendation to buy or sell any stock, and does not take account of your objectives, or your financial situation. We aim to bring you long-term focused analysis driven by fundamental data. Note that our analysis may not factor in the latest price-sensitive company announcements or qualitative material. Simply Wall St has no position in any stocks mentioned.
Have feedback on this article? Concerned about the content? Get in touch with us directly. Alternatively, email editorial-team@simplywallst.com
