
 Yahoo Finance
 Yoong Onn Corporation Berhad (KLSE:YOCB) Has More To Do To Multiply In Value Going Forward
There are a few key trends to look for if we want to identify the next multi-bagger. In a perfect world, we'd like to see a company investing more capital into its business and ideally the returns earned from that capital are also increasing. Basically this means that a company has profitable initiatives that it can continue to reinvest in, which is a trait of a compounding machine. That's why when we briefly looked at Yoong Onn Corporation Berhad's (KLSE:YOCB) ROCE trend, we were pretty happy with what we saw.
What Is Return On Capital Employed (ROCE)?
Just to clarify if you're unsure, ROCE is a metric for evaluating how much pre-tax income (in percentage terms) a company earns on the capital invested in its business. The formula for this calculation on Yoong Onn Corporation Berhad is:
Return on Capital Employed = Earnings Before Interest and Tax (EBIT) ÷ (Total Assets - Current Liabilities)
0.11 = RM40m ÷ (RM396m - RM44m) (Based on the trailing twelve months to March 2024).
Thus, Yoong Onn Corporation Berhad has an ROCE of 11%. On its own, that's a standard return, however it's much better than the 5.6% generated by the Retail Distributors industry.
View our latest analysis for Yoong Onn Corporation Berhad
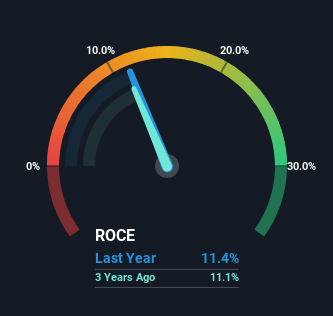
Historical performance is a great place to start when researching a stock so above you can see the gauge for Yoong Onn Corporation Berhad's ROCE against it's prior returns. If you want to delve into the historical earnings , check out these free graphs detailing revenue and cash flow performance of Yoong Onn Corporation Berhad.
What Can We Tell From Yoong Onn Corporation Berhad's ROCE Trend?
While the current returns on capital are decent, they haven't changed much. The company has consistently earned 11% for the last five years, and the capital employed within the business has risen 52% in that time. 11% is a pretty standard return, and it provides some comfort knowing that Yoong Onn Corporation Berhad has consistently earned this amount. Stable returns in this ballpark can be unexciting, but if they can be maintained over the long run, they often provide nice rewards to shareholders.
The Bottom Line On Yoong Onn Corporation Berhad's ROCE
The main thing to remember is that Yoong Onn Corporation Berhad has proven its ability to continually reinvest at respectable rates of return. And long term investors would be thrilled with the 154% return they've received over the last five years. So while the positive underlying trends may be accounted for by investors, we still think this stock is worth looking into further.
If you'd like to know about the risks facing Yoong Onn Corporation Berhad, we've discovered 2 warning signs that you should be aware of.
While Yoong Onn Corporation Berhad may not currently earn the highest returns, we've compiled a list of companies that currently earn more than 25% return on equity. Check out this free list here.
Have feedback on this article? Concerned about the content? Get in touch with us directly. Alternatively, email editorial-team (at) simplywallst.com.
This article by Simply Wall St is general in nature. We provide commentary based on historical data and analyst forecasts only using an unbiased methodology and our articles are not intended to be financial advice. It does not constitute a recommendation to buy or sell any stock, and does not take account of your objectives, or your financial situation. We aim to bring you long-term focused analysis driven by fundamental data. Note that our analysis may not factor in the latest price-sensitive company announcements or qualitative material. Simply Wall St has no position in any stocks mentioned.
Have feedback on this article? Concerned about the content? Get in touch with us directly. Alternatively, email editorial-team@simplywallst.com
