
 Yahoo Finance
 Returns On Capital At CYL Corporation Berhad (KLSE:CYL) Have Stalled
Did you know there are some financial metrics that can provide clues of a potential multi-bagger? In a perfect world, we'd like to see a company investing more capital into its business and ideally the returns earned from that capital are also increasing. Basically this means that a company has profitable initiatives that it can continue to reinvest in, which is a trait of a compounding machine. In light of that, when we looked at CYL Corporation Berhad (KLSE:CYL) and its ROCE trend, we weren't exactly thrilled.
Return On Capital Employed (ROCE): What Is It?
For those who don't know, ROCE is a measure of a company's yearly pre-tax profit (its return), relative to the capital employed in the business. To calculate this metric for CYL Corporation Berhad, this is the formula:
Return on Capital Employed = Earnings Before Interest and Tax (EBIT) ÷ (Total Assets - Current Liabilities)
0.13 = RM8.6m ÷ (RM72m - RM5.2m) (Based on the trailing twelve months to January 2024).
Therefore, CYL Corporation Berhad has an ROCE of 13%. In absolute terms, that's a satisfactory return, but compared to the Packaging industry average of 8.6% it's much better.
Check out our latest analysis for CYL Corporation Berhad
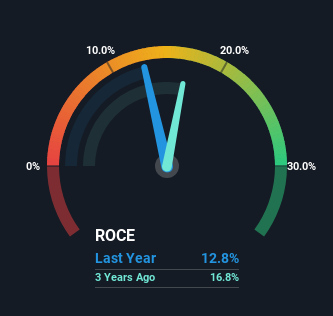
Historical performance is a great place to start when researching a stock so above you can see the gauge for CYL Corporation Berhad's ROCE against it's prior returns. If you're interested in investigating CYL Corporation Berhad's past further, check out this free graph covering CYL Corporation Berhad's past earnings, revenue and cash flow.
What Can We Tell From CYL Corporation Berhad's ROCE Trend?
Things have been pretty stable at CYL Corporation Berhad, with its capital employed and returns on that capital staying somewhat the same for the last five years. Businesses with these traits tend to be mature and steady operations because they're past the growth phase. So unless we see a substantial change at CYL Corporation Berhad in terms of ROCE and additional investments being made, we wouldn't hold our breath on it being a multi-bagger.
In Conclusion...
In summary, CYL Corporation Berhad isn't compounding its earnings but is generating stable returns on the same amount of capital employed. Although the market must be expecting these trends to improve because the stock has gained 45% over the last five years. However, unless these underlying trends turn more positive, we wouldn't get our hopes up too high.
CYL Corporation Berhad does come with some risks though, we found 2 warning signs in our investment analysis, and 1 of those doesn't sit too well with us...
For those who like to invest in solid companies, check out this free list of companies with solid balance sheets and high returns on equity.
Have feedback on this article? Concerned about the content? Get in touch with us directly. Alternatively, email editorial-team (at) simplywallst.com.
This article by Simply Wall St is general in nature. We provide commentary based on historical data and analyst forecasts only using an unbiased methodology and our articles are not intended to be financial advice. It does not constitute a recommendation to buy or sell any stock, and does not take account of your objectives, or your financial situation. We aim to bring you long-term focused analysis driven by fundamental data. Note that our analysis may not factor in the latest price-sensitive company announcements or qualitative material. Simply Wall St has no position in any stocks mentioned.
Have feedback on this article? Concerned about the content? Get in touch with us directly. Alternatively, email editorial-team@simplywallst.com
