
 Yahoo Finance
 Those who invested in Coterra Energy (NYSE:CTRA) three years ago are up 95%
One simple way to benefit from the stock market is to buy an index fund. But many of us dare to dream of bigger returns, and build a portfolio ourselves. For example, Coterra Energy Inc. (NYSE:CTRA) shareholders have seen the share price rise 60% over three years, well in excess of the market return (14%, not including dividends). However, more recent returns haven't been as impressive as that, with the stock returning just 14% in the last year, including dividends.
So let's assess the underlying fundamentals over the last 3 years and see if they've moved in lock-step with shareholder returns.
Check out our latest analysis for Coterra Energy
While the efficient markets hypothesis continues to be taught by some, it has been proven that markets are over-reactive dynamic systems, and investors are not always rational. One imperfect but simple way to consider how the market perception of a company has shifted is to compare the change in the earnings per share (EPS) with the share price movement.
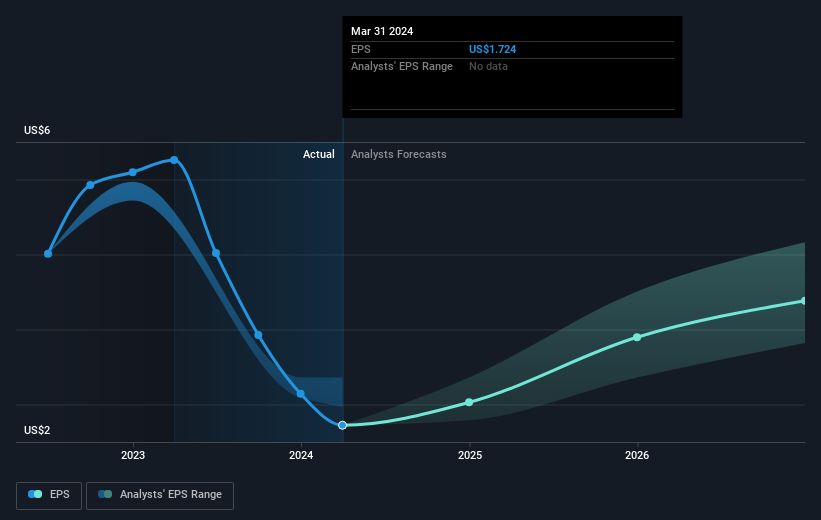
During three years of share price growth, Coterra Energy achieved compound earnings per share growth of 37% per year. This EPS growth is higher than the 17% average annual increase in the share price. So one could reasonably conclude that the market has cooled on the stock.
You can see how EPS has changed over time in the image below (click on the chart to see the exact values).
We know that Coterra Energy has improved its bottom line over the last three years, but what does the future have in store? If you are thinking of buying or selling Coterra Energy stock, you should check out this FREE detailed report on its balance sheet.
What About Dividends?
It is important to consider the total shareholder return, as well as the share price return, for any given stock. The TSR is a return calculation that accounts for the value of cash dividends (assuming that any dividend received was reinvested) and the calculated value of any discounted capital raisings and spin-offs. Arguably, the TSR gives a more comprehensive picture of the return generated by a stock. In the case of Coterra Energy, it has a TSR of 95% for the last 3 years. That exceeds its share price return that we previously mentioned. And there's no prize for guessing that the dividend payments largely explain the divergence!
A Different Perspective
Coterra Energy shareholders gained a total return of 14% during the year. But that was short of the market average. The silver lining is that the gain was actually better than the average annual return of 8% per year over five year. This could indicate that the company is winning over new investors, as it pursues its strategy. I find it very interesting to look at share price over the long term as a proxy for business performance. But to truly gain insight, we need to consider other information, too. Consider for instance, the ever-present spectre of investment risk. We've identified 3 warning signs with Coterra Energy , and understanding them should be part of your investment process.
If you are like me, then you will not want to miss this free list of undervalued small caps that insiders are buying.
Please note, the market returns quoted in this article reflect the market weighted average returns of stocks that currently trade on American exchanges.
Have feedback on this article? Concerned about the content? Get in touch with us directly. Alternatively, email editorial-team (at) simplywallst.com.
This article by Simply Wall St is general in nature. We provide commentary based on historical data and analyst forecasts only using an unbiased methodology and our articles are not intended to be financial advice. It does not constitute a recommendation to buy or sell any stock, and does not take account of your objectives, or your financial situation. We aim to bring you long-term focused analysis driven by fundamental data. Note that our analysis may not factor in the latest price-sensitive company announcements or qualitative material. Simply Wall St has no position in any stocks mentioned.
